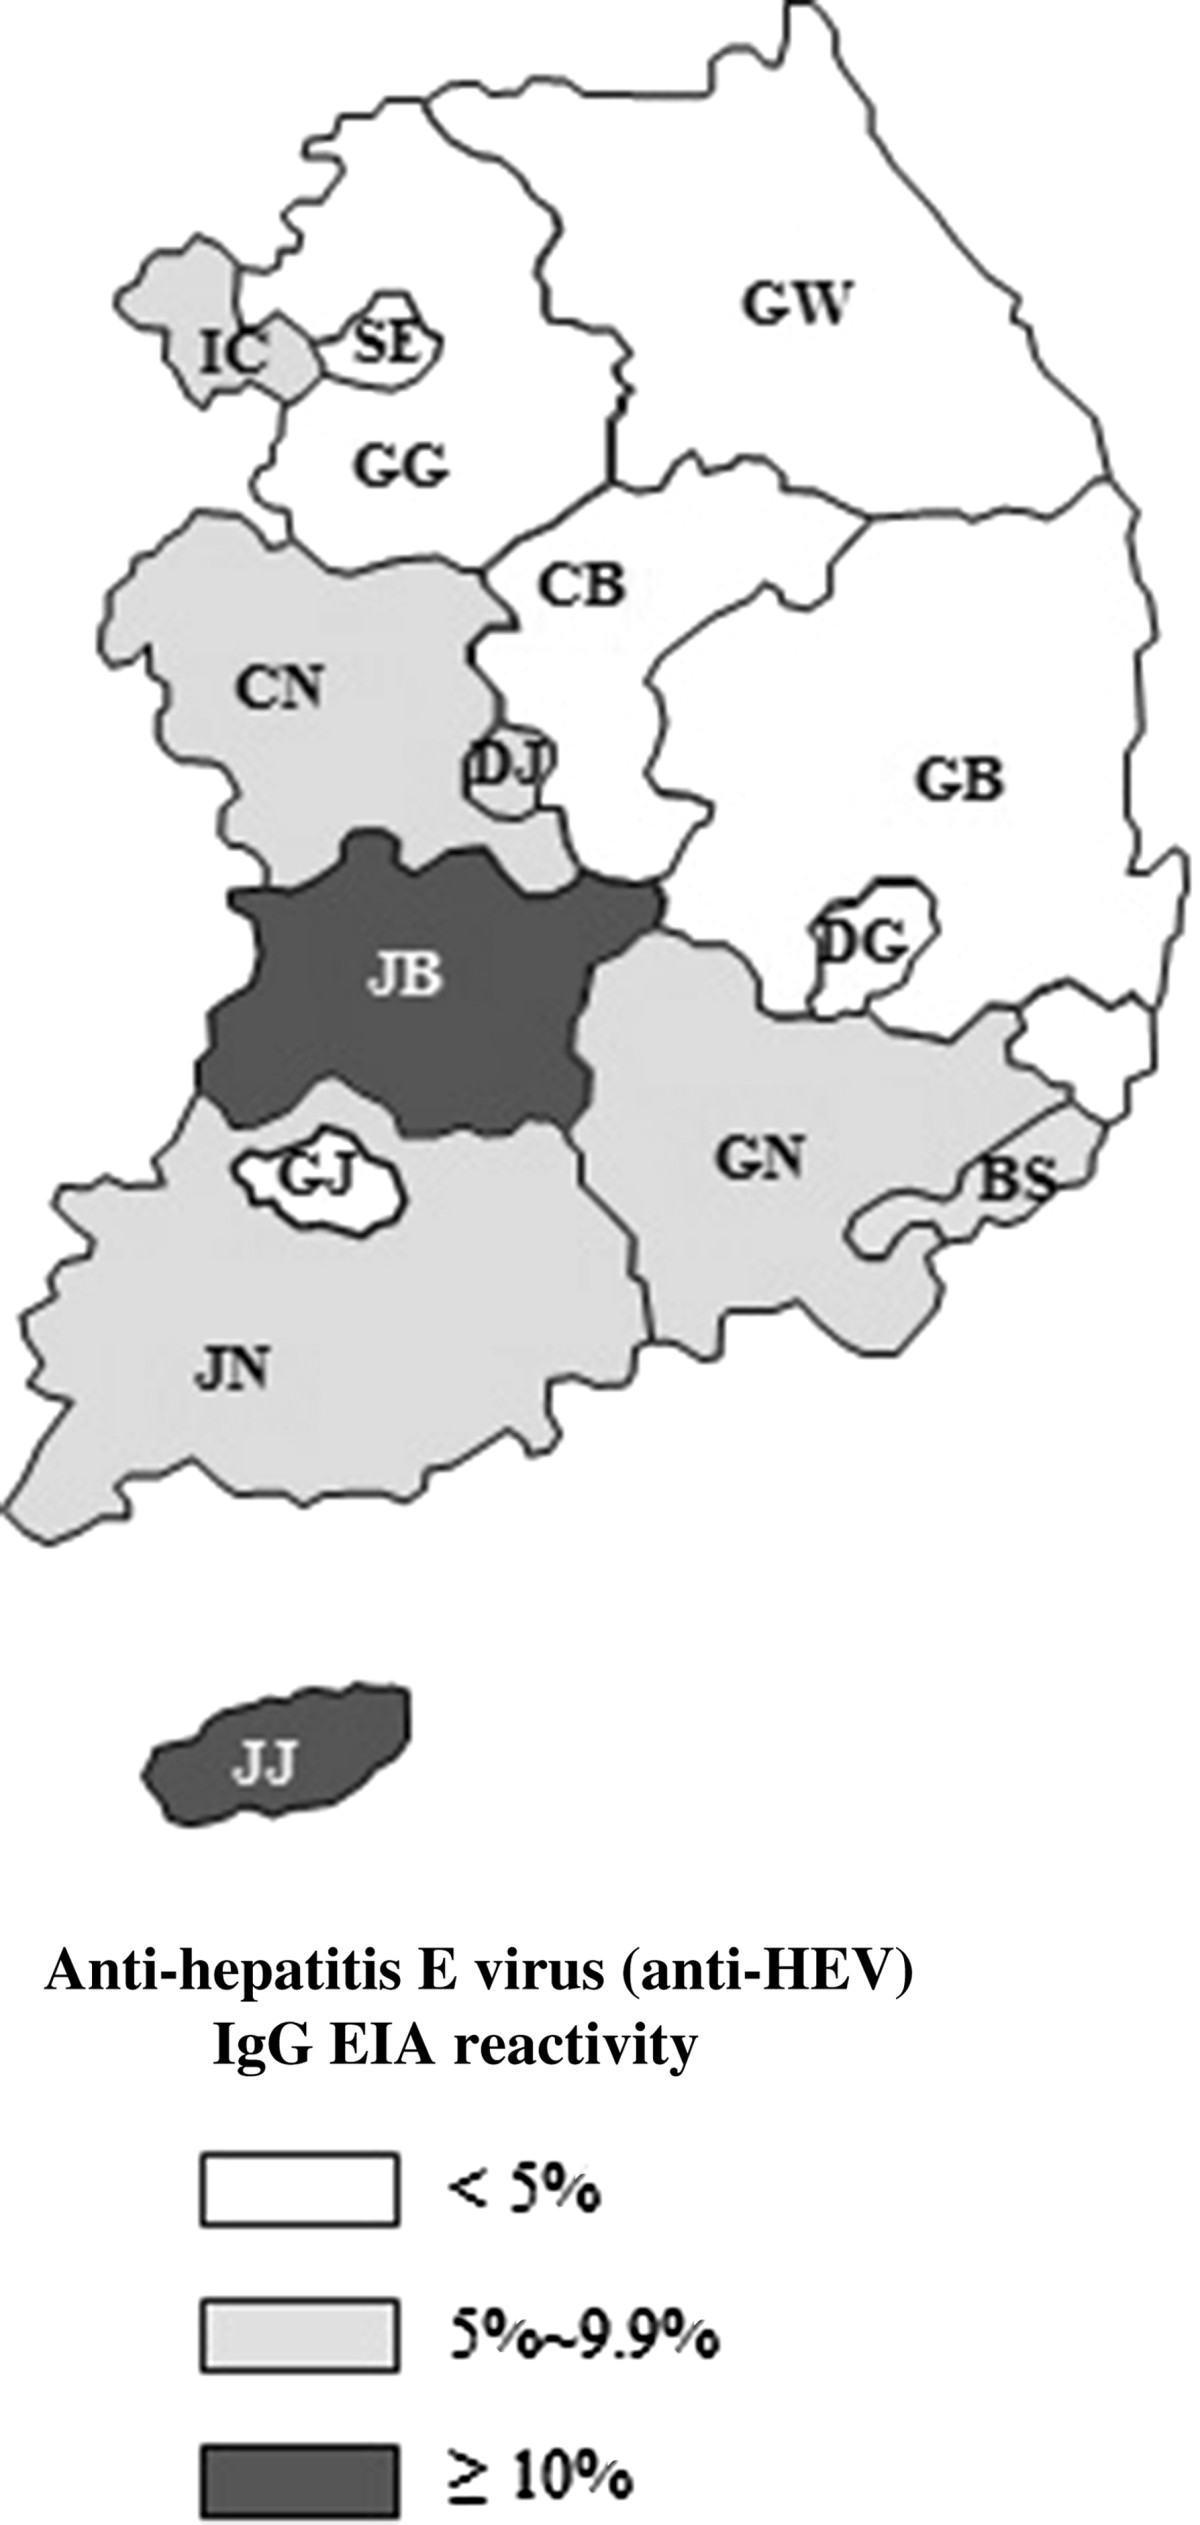
Figure 1.

Map of Korea showing a frequency of anti-hepatitis E virus (anti-HEV) Ig G EIA reactivity in the 16 regions of the Korea National Health and Nutrition Examination Survey, 2007–2009. GW, Gangwon-do; GG, Gyeonggi-do; GN, Gyeongsangnam-do; GB, Gyeongsangbuk-do; GJ, Gwangju; DG, Daegu; DJ, Daejeon; BS, Busan; SE, Seoul; US, Ulsan; IC, Incheon; JN, Jeollanam-do; JB, Jeollabuk-do; JJ, Jeju-do; CN, Chungchengnam-do; CB, Chungchengbuk-do.
