Figure 3.

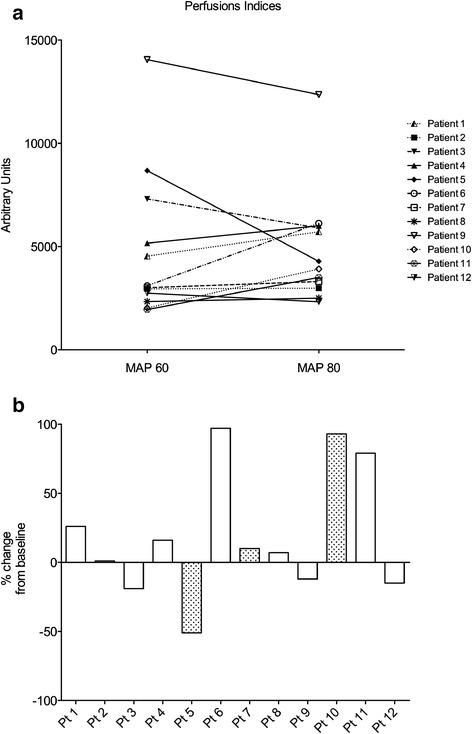
Perfusion indices patient per patient. (a) Raw data (arbitrary units). (b) Percentage change from baseline. Grey bars are for patients (Pt) with chronic hypertension (Pt 5, 7 and 10). MAP, mean arterial pressure.

Perfusion indices patient per patient. (a) Raw data (arbitrary units). (b) Percentage change from baseline. Grey bars are for patients (Pt) with chronic hypertension (Pt 5, 7 and 10). MAP, mean arterial pressure.