
Figure 1.
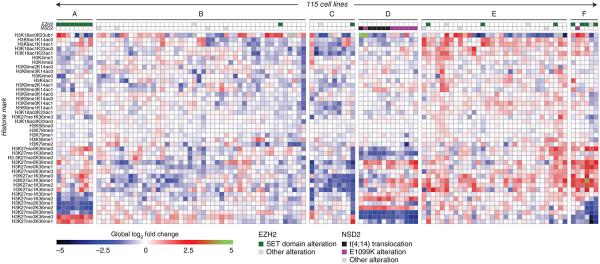
Global chromatin profiling identifies distinct molecular chromatin-signature profiles in the CCLE collection. We subjected 115 cell lines to molecular chromatin-signature profiling by MS. Each row corresponds to a H3 peptide with the specific combination of marks shown (left). The value in each cell of the heatmap corresponds to the log2-fold change of the mark combination versus the median for each row. EZH2 and NSD2 status are indicated. Clusters A–F are identified for reference in the main text.