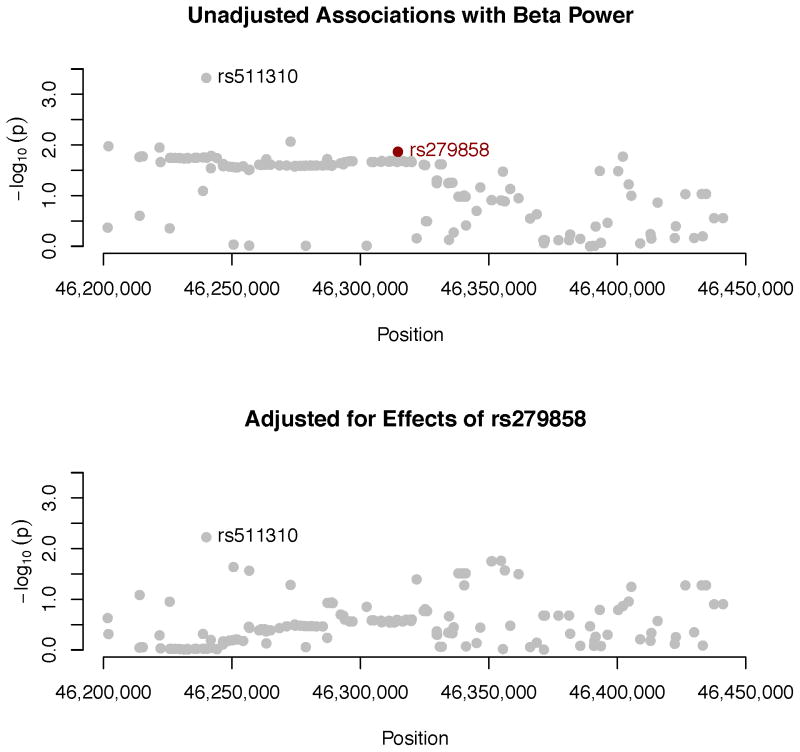
Figure 15.
Associations between individual SNPs within or near GABRA2 and beta power. SNPs were imputed with reference to 1000 Genomes haplotypes (see text for additional detail). p-values produced by RFGLS analyses of the dosages for these imputed SNPs are expressed as −log10(p). SNP positions are from GRCh37 build 37 (hg19). Raw p-values are plotted in the upper panel. rs279858, which tags a haplotype associated with problematic alcohol use (Enoch, 2008), is indicated in black. The lower panel gives results are from a follow-up analysis that adjusts for effects of this SNP as an additional covariate, to determine to what extent the elevated p-values in the upper panel likely represent a single signal.

