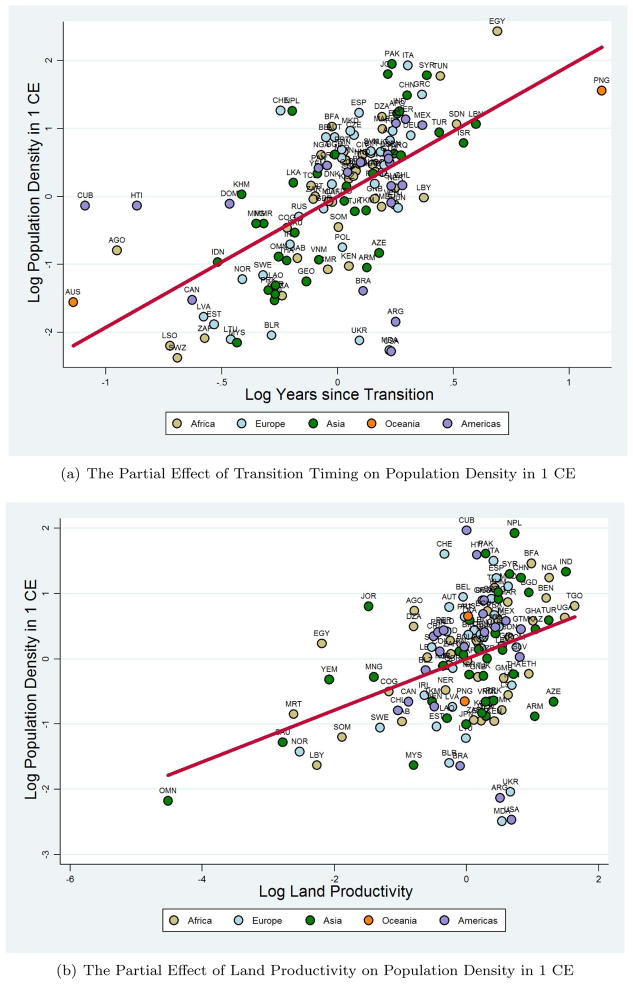
Figure D.2.
Transition Timing, Land Productivity, and Population Density in 1 CE
Summary – This figure depicts the partial regression line for the effect of transition timing (land productivity) on population density in the year 1 CE, while controlling for the influence of land productivity (transition timing), absolute latitude, access to waterways, and continental fixed effects. Thus, the x- and y-axes plot the residuals obtained from regressing transition timing (land productivity) and population density, respectively, on the aforementioned set of covariates.

