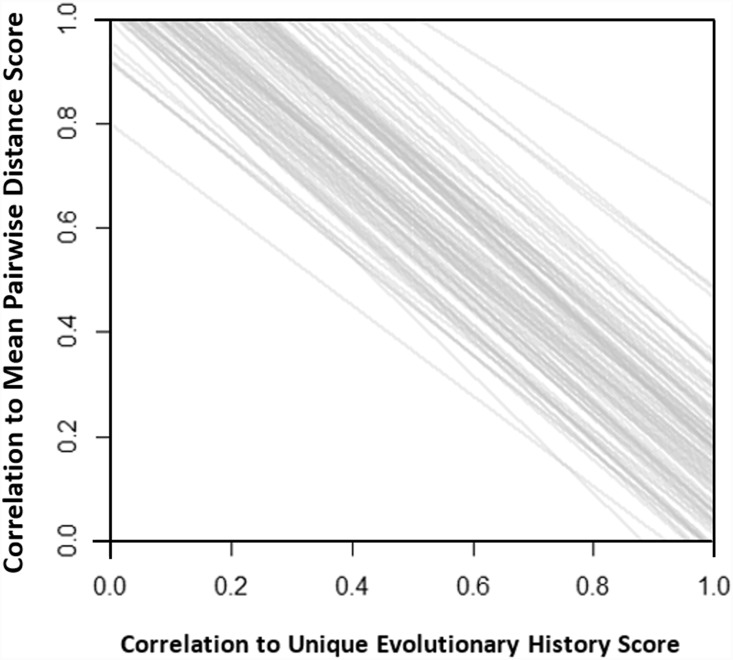
Figure 4. Fitted lines from linear models describing relationship between pairs of correlation scores (8 pairs of data points per line) across 1000 randomly simulated 100-tip trees (Birth-death 100 tips λ = 0.5 and µ = 0.25).
The average adjusted R2 across the 1000 trees = 0.9, s.d. = 0.07. Correlations were calculated between each tip’s evolutionary isolation scores (8 per tree) and two sub-components of evolutionary isolation: The amount of unique evolutionary history a species possess and the mean pairwise distance to all other species.

