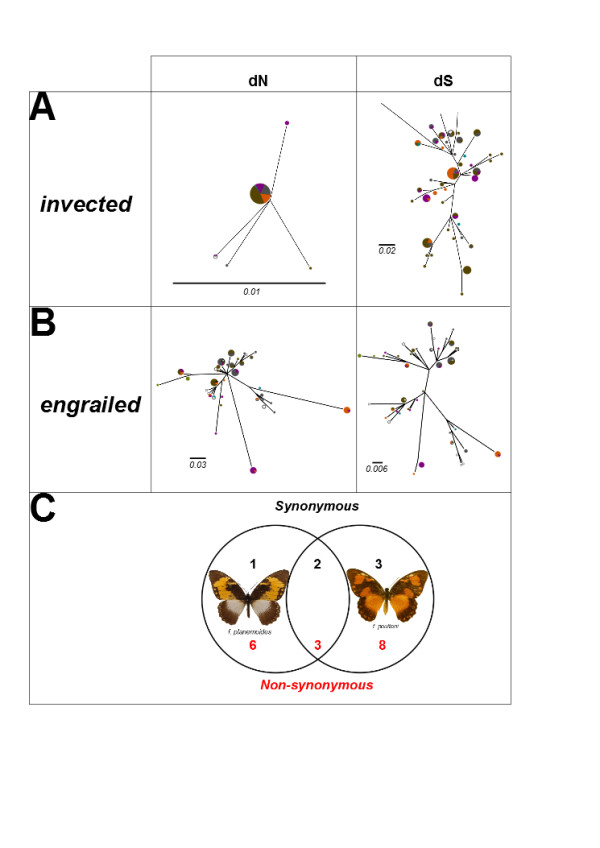
Figure 7.

The structure of genetic variation in invected and engrailed. Gene trees were established by maximum likelihood for invected (A) and engrailed (B) haplotypes, separately from non-synonymous and synonymous nucleotide changes. Branch lengths correspond to the number of changes. The area of each pie is scaled in proportion to the frequency of that haplotype among the morphs sampled, and colours of pies reflect proportion of haplotypes recovered from each morph, labelled as in Figure 4. (C) Unique SNPs in the two morph-associated alleles relative to the consensus sequence for all other inferred P. dardanus alleles.
