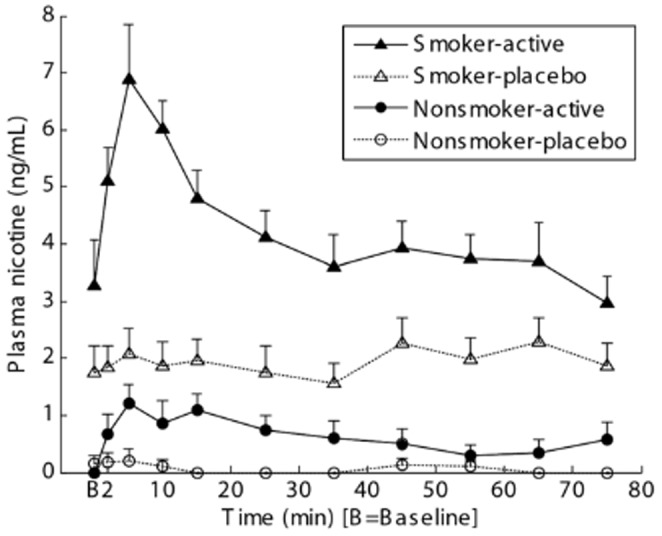
Figure 1. Line plots of mean concentrations across subjects of nicotine in plasma versus time of active and placebo cigarette scans.

PET data acquisition began between 5 and 10 min on the time axis in individual subjects.

PET data acquisition began between 5 and 10 min on the time axis in individual subjects.