
Figure 4.
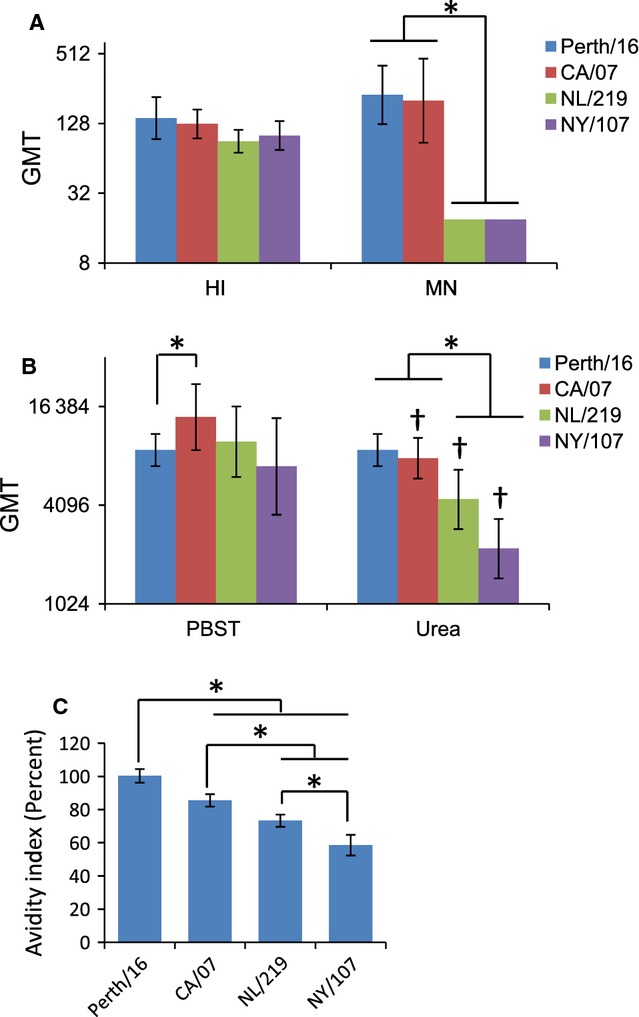
Hemagglutination inhibition (HI) and microneutralization (MN) titers and avidity ELISA for mice with HI titers between 80 and 160. Serum samples with HI titers between 80 and 160 were selected (n = 6 mice per group). (A) geometric mean titer (GMT) HI and MN titers for each group. (B) Avidity ELISAs were performed with the addition of 5-min incubation with either PBST or 4M urea. Values are shown as GMT. Differences between PBS and urea-treated samples are indicated by ‘†’ (P < 0·05). (C) The avidity index (AI) was calculated for each sample. Values are shown as average AI (percent). Error bars represent 95% confidence intervals. Differences between groups are indicated by * (0·0001 < P < 0·05) or ** (P < 0·0001).