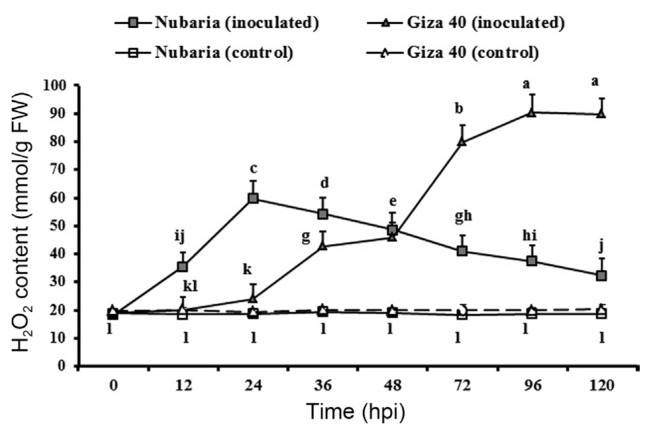
Fig. 2.
Time course of the changes in H2O2 content (expressed as mmol/g FW) in leaves of resistant (Nubaria) and susceptible (Giza 40) FB cultivars inoculated with B. fabae as compared with un-inoculated controls. The experiment was conducted twice and the data for the two experiments were combined. Each value is the means of six replicates (of two experiments). Different letters indicate significant differences at P<0.05. Error bars represent the standard deviations of the mean.

