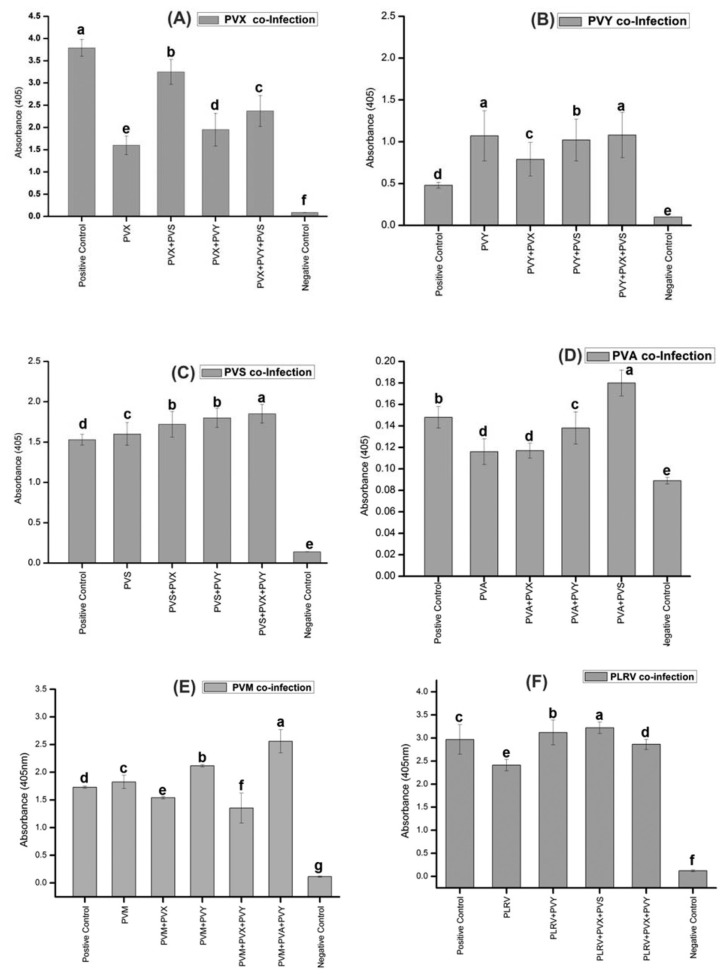
Fig. 3.
Absorbance values for singly and co-infected potato plants cv. Desiree. Detection of (A) PVX, (B) PVY, (C) PVS, (D) PVA, (E) PVM and (F) PLRV. The results are grouped according to viruses present in plants. Positive and negative controls were provided with the kit. Bar represents standard deviation of three replicates and represented with the same letter (a, b and d) are not significantly different (P<0.001).

