
Fig. 1.
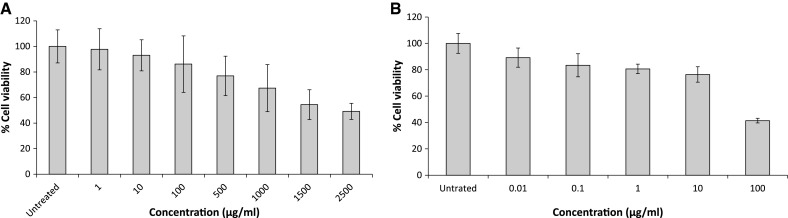
Evaluation of fucoidan (A) and ribavirin (B) cytotoxicity to Vero cells using the MTT assay. Control: cells without treatment. Bars represent means, with vertical lines indicating standard deviations, n = 9, *p ≤ 0.05
Official websites use .gov
A
.gov website belongs to an official
government organization in the United States.
Secure .gov websites use HTTPS
A lock (
) or https:// means you've safely
connected to the .gov website. Share sensitive
information only on official, secure websites.
Evaluation of fucoidan (A) and ribavirin (B) cytotoxicity to Vero cells using the MTT assay. Control: cells without treatment. Bars represent means, with vertical lines indicating standard deviations, n = 9, *p ≤ 0.05