
Figure 2. Protein mass and fractional growth rates.
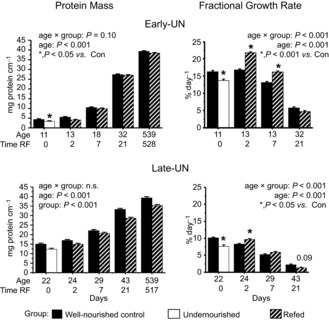
Protein mass and fractional growth rates of pooled gastrocnemius, tibialis anterior and quadriceps muscle from one hind limb of Control mice, mice undernourished from PN1 to PN11 (Early-UN) or PN11 to PN22 (Late-UN), or refed (RF) for 2 days, 7 days, 21 days or 18 months (protein mass only). Protein mass is normalized for bone length. Fractional growth rates were calculated using the first derivative of a polynomial that described the change of muscle protein mass with age for each litter. Values are least square means ± SEM; n = 7–8 litters per treatment group.*Significant difference between age-matched groups where age×group is significant.