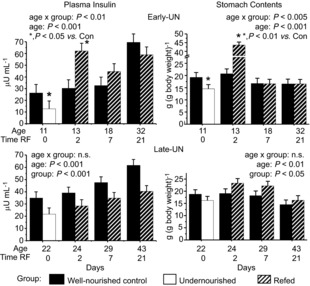
Figure 5. Serum insulin concentrations and weight of food in the stomach.

Serum insulin concentrations and weight of food in the stomach immediately following death for Control mice, mice undernourished from PN1 to PN11 (Early-UN) or PN11 to PN22 (Late-UN), or refed (RF) for 2, 7 or 21 days. Values are least square means ± SEM; n = 7–8 litters per treatment group.*Significant difference between age-matched groups where age×group is significant.
