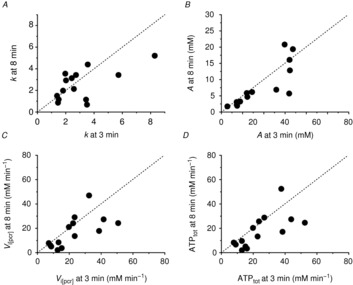
Figure 2. Moderate-intensity exercise recovery rate constant (k; A), amplitude of PCr resynthesis (termed ‘A’; B), initial rate of PCr resynthesis (Vi[PCr]; C) and total ATP turnover rate (ATPtot; D) at 8 min of exercise, plotted as a function of 3 min of exercise.

Dashed line is y = x.
