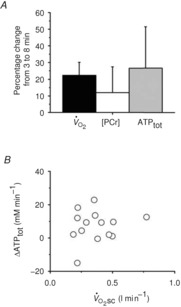
Figure 4. Magnitudes and relationship between  slow component and muscle [PCr] and ATPtot slow components.

 and [PCr]sc and ΔATPtot from minute 3 to 8 of heavy exercise expressed as a percentage change (A). B shows ΔATPtot during heavy exercise plotted as a function of the
  .
.
