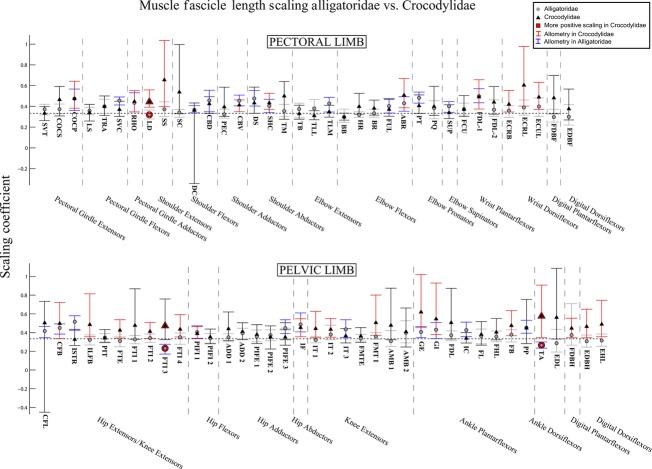
Fig. 6.
The 95% confidence intervals for scaling coefficients of limb muscle fascicle lengths on body mass (log-log) in Alligatoridae (grey circles) and Crocodylidae (black triangles). Muscles with significantly higher coefficients in Crocodylidae are highlighted with red markers. Muscles of Crocodylidae that show allometry have their confidence intervals drawn in red. Those of Alligatoridae that show allometry have their confidence intervals drawn in blue. See Table 1 for muscle abbreviations.

