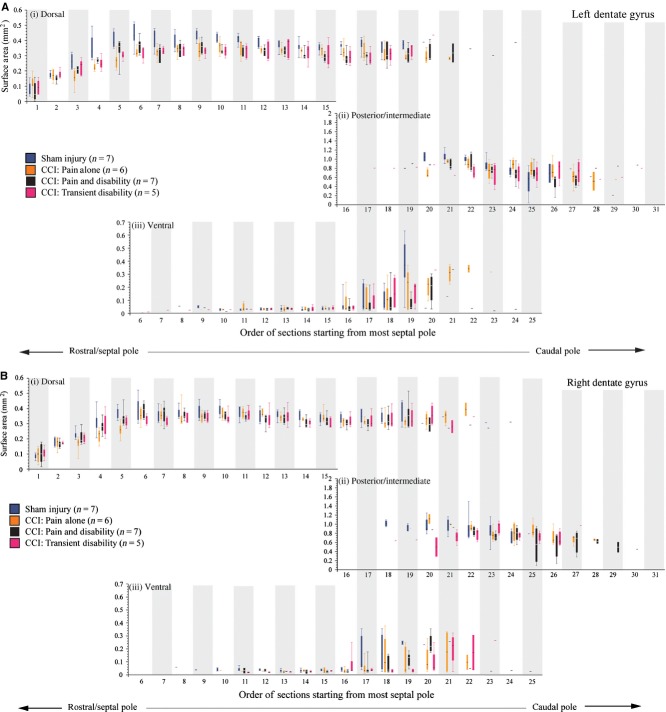
Fig. 6.
Box plots illustrating the means and range of the surface areas of the left (A) and right (B) dentate gyrus in the following groups: sham-injured control rats (n = 7, blue); Pain alone following CCI (n = 5, yellow); Pain and Disability following CCI (n = 6, black); and Pain and Transient Disability following CCI (n = 5, pink). Serial sections were analysed and plotted from the septal pole (dorsal hippocampus) to the posterior/intermediate pole of the dentate gyrus. Surface area sizes for the dorsal, ventral and posterior/intermediate subregions of the dentate gyrus are shown in panels (i–iii).

