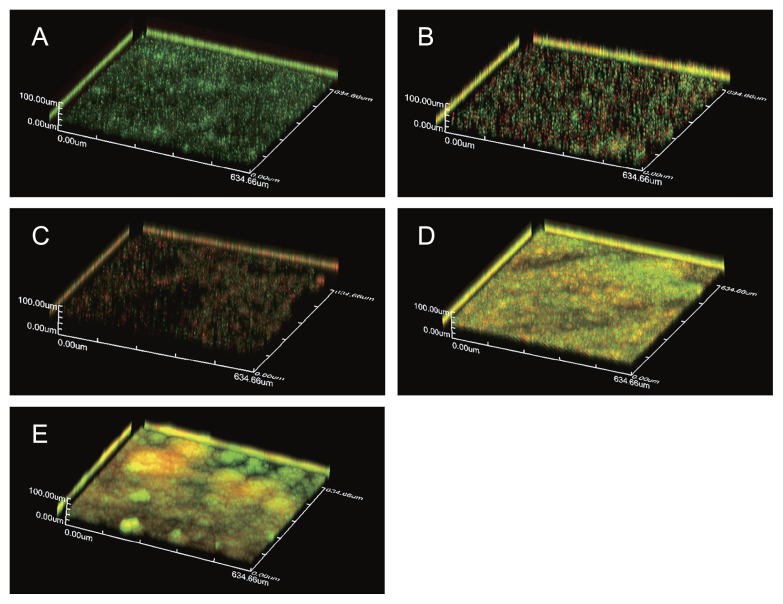
Fig. 4.
CLSM analysis of a single P-1M biofilm (A), single P-14S biofilm (B), single P-20N biofilm (C), mixed P-1M and P-14S biofilm (D), and mixed P-1M and P-20N biofilm (E). Single- and dual-biofilms were formed on sterile glass cover slips and stained using a FilmTracer LIVE/DEAD Biofilm Viability kit. Samples were rinsed with sterilized water and examined using a FluoView FV10 laser scanning confocal microscope. Live cells are stained green and dead cells are stained red. The z-axis scale bar represents 100 μm.

