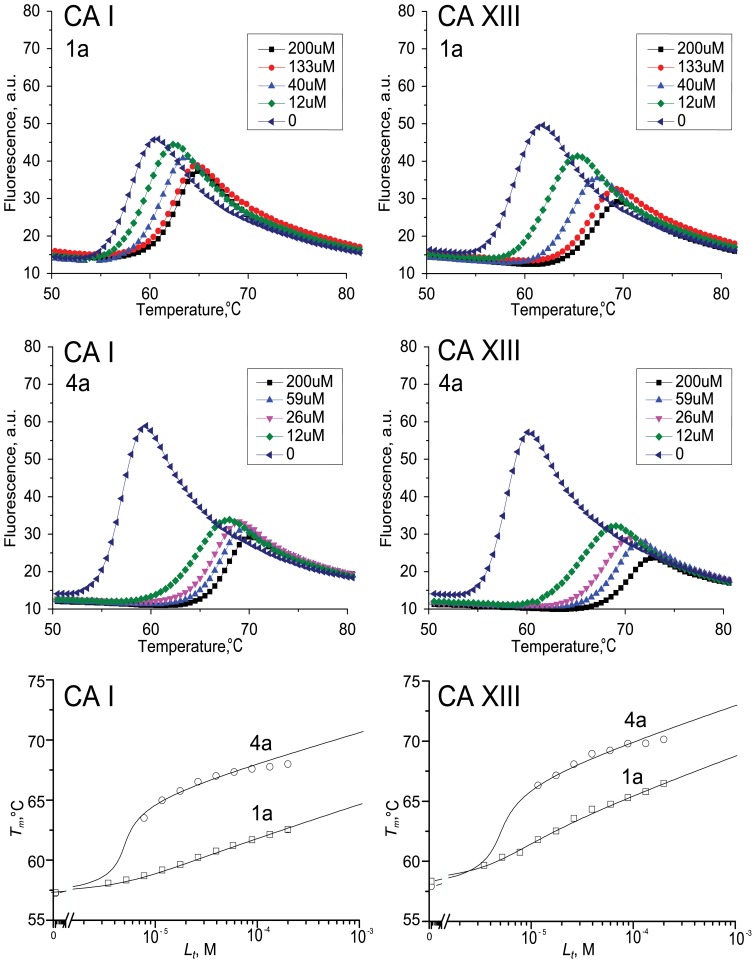
Figure 2. Fluorescent thermal shift assay data for selected compound 1a and 4a binding to CA I and CA XIII.
Top graphs show raw protein denaturation curves and the bottom graphs show the compound dosing curves. Datapoints are the experimental midpoints of the denaturation curves while the lines are drawn according to the model [39].

