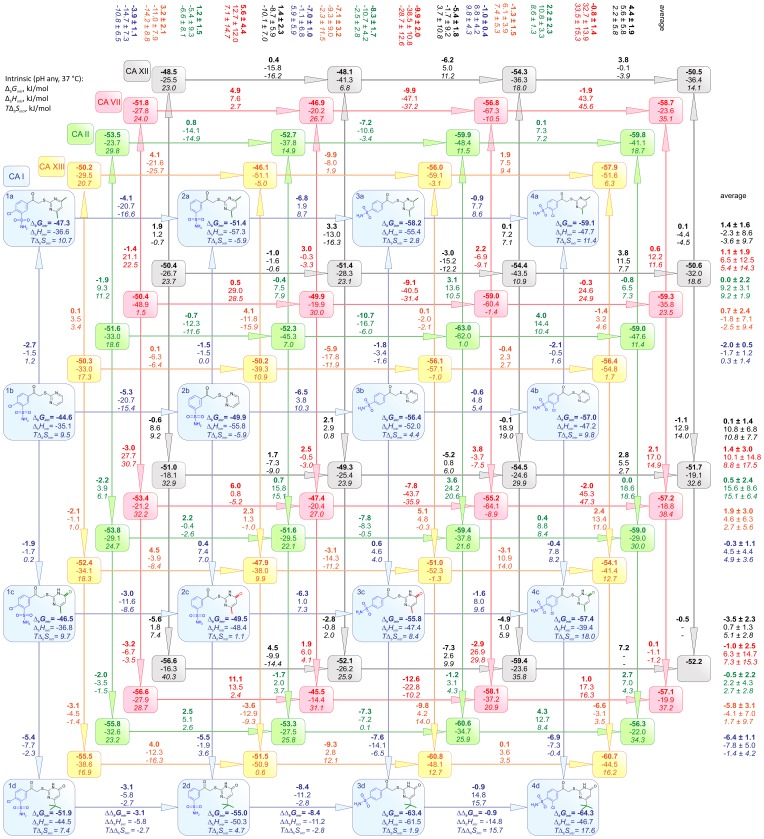
Figure 8. Inhibitor structure correlations with the thermodynamics of binding.
Intrinsic parameters of compound binding to five investigated CA isoforms are given within the shapes. Different colors represent different CA isoforms. Numbers next to arrows show the Gibbs free energy (top number, bold), enthalpy (middle number), and entropy (TΔbS, bottom number) of binding differences between two neighboring compounds (in kJ/mol at 37°C). Numbers to the top and right of the map are averages between same heads and tails of the compounds. The standard deviations indicate the presence and absence of the energetic additivity of compound functional groups.

