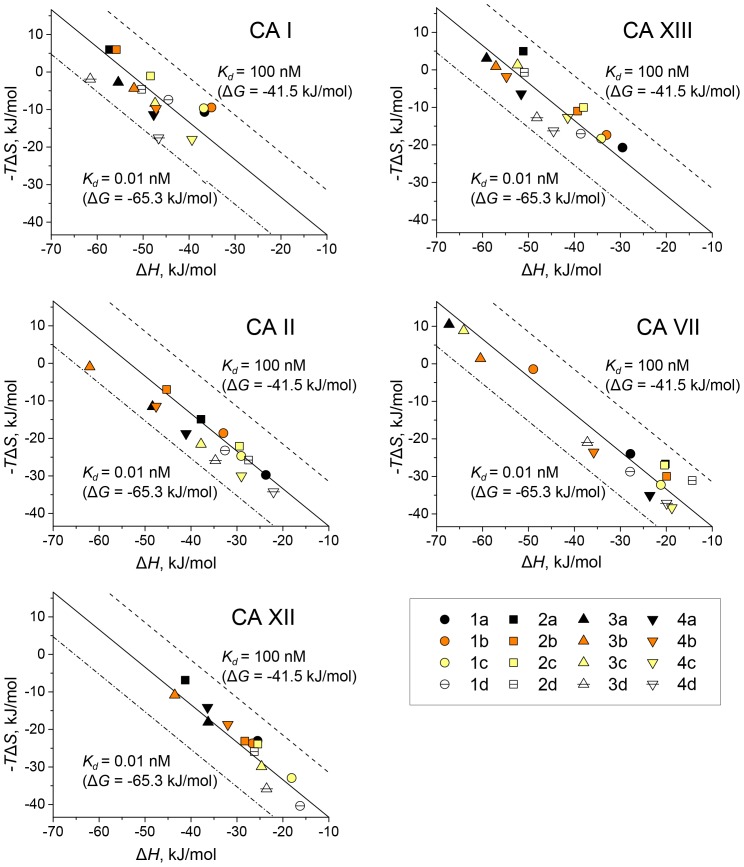
Figure 9. The intrinsic enthalpy – entropy compensation graphs for the 16 studied compound binding to five CA isoforms.
Diagonal central line represents the dissociation constant of 1.0 nM (ΔbG = −53.4 kJ/mol at 37°C) while adjacent dashed lines show extremely tight binding of 10 pM or lower affinity at 100 nM. The compounds exhibit the range of affinities between 0.01 and 10 nM (ΔbG between −65.3 and −47.5 kJ/mol) while the enthalpies varied to a greater extent between −14 and −68 kJ/mol. The entropies (TΔbS) also span the wide range between 11 and −41 kJ/mol.

