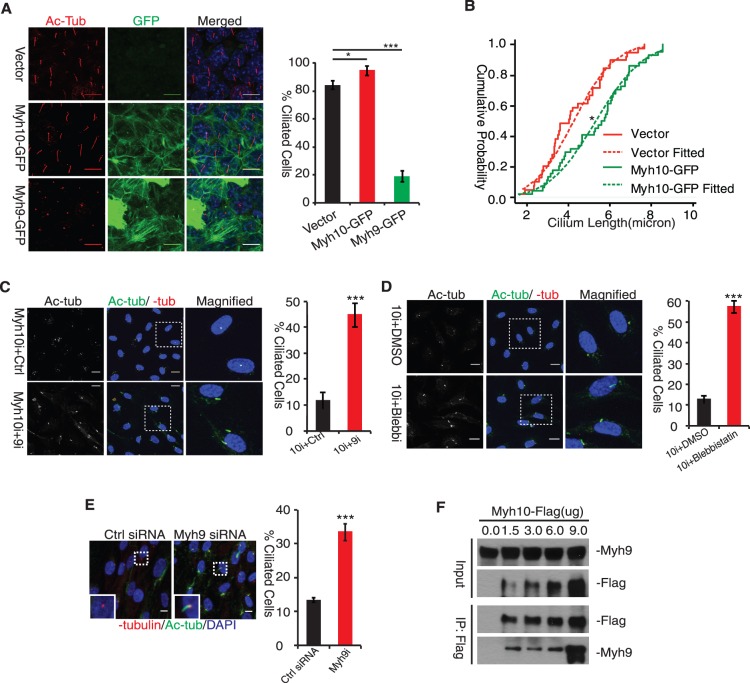
Figure 2. Myh10 Counteracts Myh9 Activity to Promote Ciliogenesis.
(A) Myh10 and Myh9 displayed opposing activity on ciliogenesis. IMCD3 cells were stably transfected with pCR3.1 vector (left panel, upper row), CMV-Myh9-GFP (left panel, bottom row) and CMV-Myh10-GFP (left panel, middle row) and grew to confluence to induce ciliogenesis. Cells were fixed and stained with acetylated tubulin antibody to label cilia. Percent of cells with cilia longer than 1 µm were counted and plotted (upper right panel). Scale bars: 10 µm. Error bars represents standard deviations (s.d.) from triple replicates. ***, t-test, p<0.001. (B) Myh10 overexpression promotes cilia elongation. Cilia length in vector and Myh10-GFP cells was plotted (lower right panel) as cumulative probability distribution curve (solid line) and fitted with normal distribution function curve (dash line). *, t-test p<0.01. (C) Myh9 knockdown partially rescued cilia defects in Myh10 knockdown cells. Myh10 siRNA duplex transfected RPE-Mchr1GFP cells were transfected with either control (left panel, upper row) or Myh9 (left panel, bottom row) siRNA then serum starved to induce ciliogenesis. Percent of ciliated cells was quantified and shown in right panel. White insets were magnified to allow better visualization of representative primary cilia (left panel, right column). Scale bars: 10 µm. Error bars represents standard deviations (s.d.) from triple replicates. ***, t-test p<0.001. (D) Blebbistatin treatment partially restored cilia defects in Myh10 knockdown cells. Myh10-knockdown RPE-Mchr1GFP cells were treated with either DMSO or 25 µM blebbistatin when inducing ciliogenesis. Percent of ciliated cells was quantified and shown in right panel. White insets were magnified to allow better visualization of representative primary cilia (left panel, right column). Scale bars: 10 µm. Error bars represents standard deviations (s.d.) from triple replicates. ***, t-test p<0.001. (E) Myh9 knockdown promoted spontaneous ciliogenesis. Control and Myh9-knockdown RPE-Mchr1GFP cells were switched to DMEM with 5% FBS for 24 hours then fixed and labeled with acetylated tubulin (green) and γ-tubulin (red) antibody to visualize cilia and basal body. Percent of ciliated cells was quantified (right panel). Scale bars: 10 µm. Error bars represents standard deviations (s.d.) from triple replicates. ***, t-test, p<0.001. (F) Myh9 physically interacts with Myh10. HEK293-T cells were transfected with different amount of MSCV-Flag-HA-Myh10 plasmids (0, 1.5, 3.0, 6.0, 9.0 ug) and collected for immunoprecipitation using M2-Flag affinity gel. Precipitates were analyzed for Myh10-Flag and Myh9.

