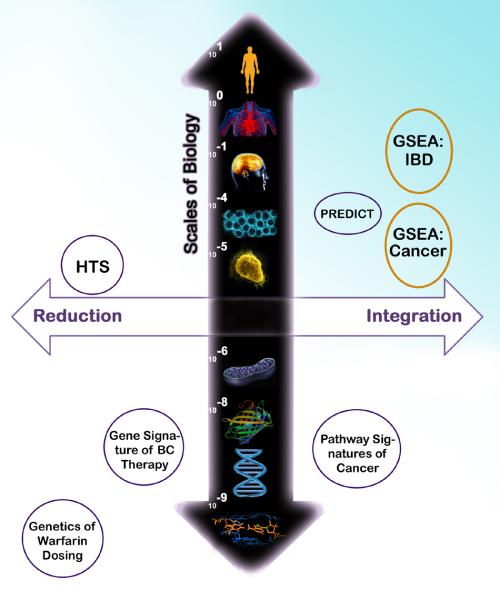
Figure 2. Biological Scales Contrasting Reductionist and Integrative Drug Repositioning Computations.
A few exemplar bioinformatics and computational biology studies of drug targeting or repositioning are used to illustrate the major differences in approaches: (i) reduction to the molecular function on the left quadrants, and (ii) integrated properties of multiple molecules to the right. The vertical axis discriminates among different scales of biological substrates for genetic or genomic assays. As shown at the DNA base pair scale, the genetics of warfarin dosage elucidated from a genome-wide association study is illustrated on the lower left quadrant (18). Gene expression signature classifiers follow at the mRNA scale (5). Integrated pathway-level scores of gene expression measures are shown in the lower right quadrant (19). High throughput screens (HTS) (11) of the upper left quadrant correspond to reductionism methods at the tissue level and contrast with increasingly integrative genome-wide tissular methods of the PREDICT algorithm (13) and that of Butte's research group conducted at the same biological scale (upper right quadrant, orange circles). Importantly, the genome-wide metric developed by Butte's group was applied to both a cellular-level disease (cancer) and a tissular one (IBD). As shown by the void in the uppermost part of the right quadrant, systemic diseases and multi-organ ones have not yet been explored by genome-wide metric and may require more comprehensive analyses than straightforward opposition of a genomic metric measured in surrogate tissues and drugs. Scales of biology (m): DNA base pairs, DNA, protein, organelle (mitochondria), cell, tissue, organ, system, organism.

