
Figure 4. The cytoplasmic membrane potential variation of P. aeruginosa 27853 treated by peptides at concentrations of 0 (open circles), 0.8 (solid circles), 1.6 (triangles), 3.2 (squares), and 6.4 (rhombus) µM, as assessed by release of the membrane potential-sensitive dye diSC3-5.
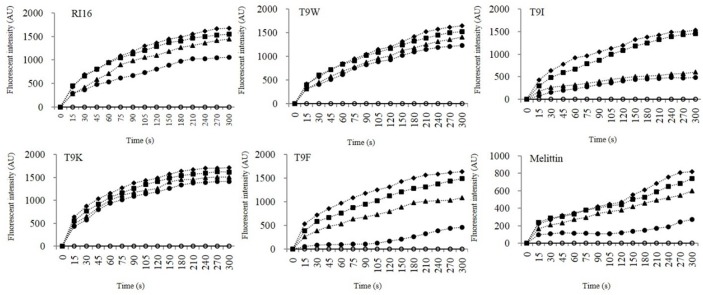
The fluorescent intensity was monitored at an excitation wavelength of 622 nm and an emission wavelength of 670 nm as a function of time.