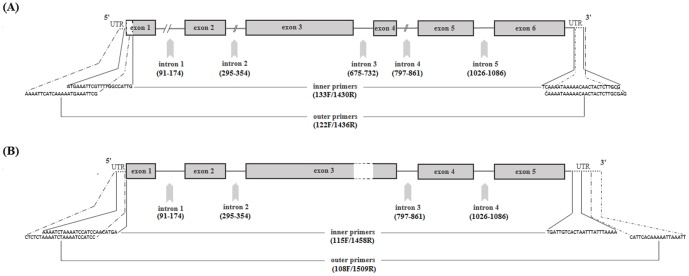
Figure 1. Gene map of Der f 1 (A) and Der p 1 (B) allergens amplified by nested PCR.
UTR: untranslated regions; (numbers): nucleotide position for introns. The blank region with dashed outlines at exon 1 indicates partial 5′end of genes (given our sequences). T3/SP4 tails (see table 1) in primer sequences are not shown.

