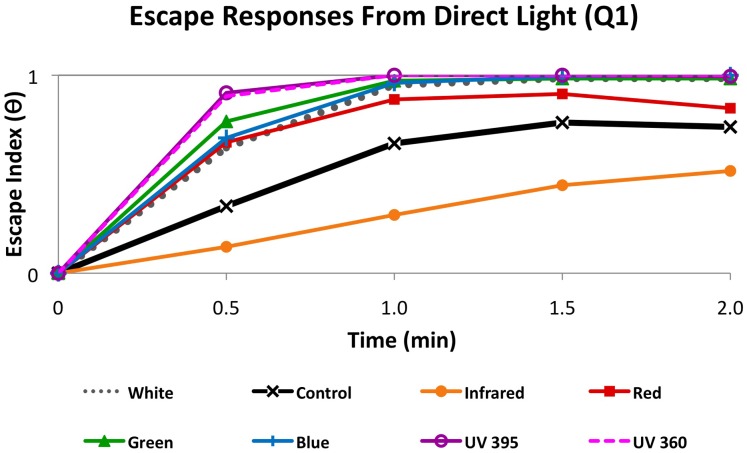
Figure 5. Escape Responses Vary by Wavelength.
Graph showing escape responses as a measure of the severity of phototactic behavior. The escape index ( ) is based on the number of worms that leave Q1 (direct light), where a value of 1 indicates all worms have left Q1. Thus, higher values indicate stronger photophobic responses. At 30 seconds, the data indicate that UV wavelengths elicited a significantly stronger escape response, distinct from both controls (p<0.001) and all other wavelengths (p<0.01); while IR wavelengths produced an opposite, attractive response (p<0.001). All time points are significantly different from controls (p<0.001) by two-way ANOVA, except for red at 1.5 minutes (p<0.01) and 2 minutes (not significant). Note the latter data indicate by 2 minutes worms have returned to the direct red light source in Q1.

