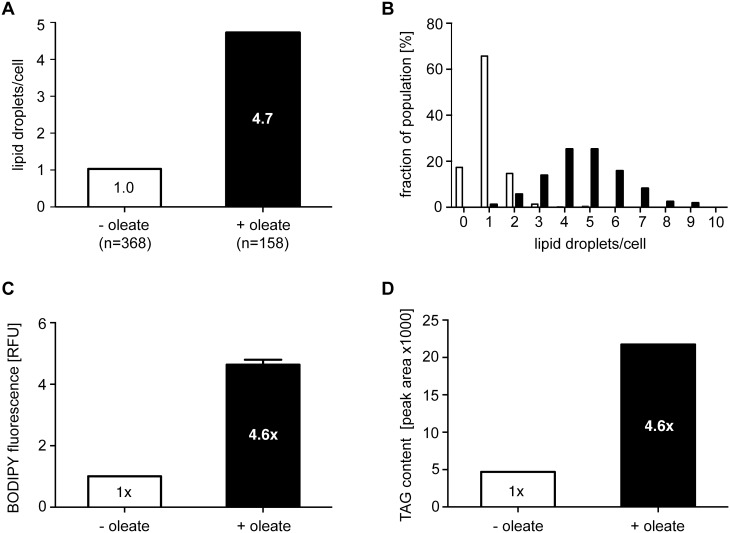
Figure 2. Quantification of the oleate-induced lipid droplet formation.
(A) BODIPY 493/503 stained LDs were counted in stacks of confocal laser scanning microscopy (CLSM) images; the average number of LDs per cell is given after oleate feeding (black column) or in the control (white column). (B) Distribution of LD numbers per cells in the population after oleate feeding (black columns) or in the control (white columns). (C) Quantification of BODIPY-stained LDs by flow cytometry after oleate feeding (black column) or in the control (white column). BODIPY 493/503 preferentially stains nonpolar lipids. Error bars give the SEM (n = 3) of values normalized to the control. (D) Quantification of TAG content by HPTLC and densitometry after oleate feeding (black columns) or in the control (white columns). Values are normalized to the control.

