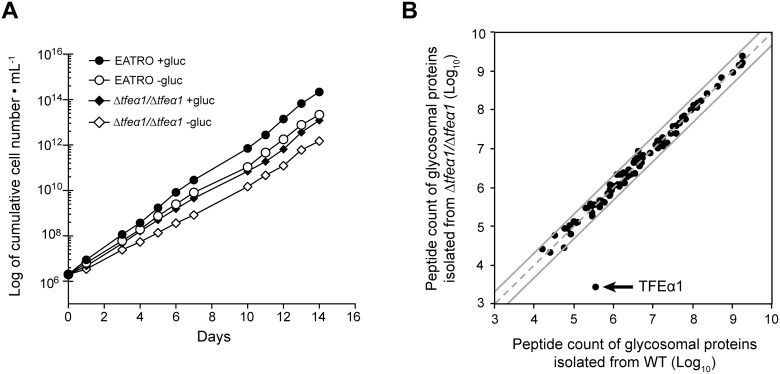
Figure 5. Phenotypic analysis of Δtfeα1/Δtfeα1 cell.
(A) growth curve of WT and Δtfeα1/Δtfeα1 cell knock cells in glucose-rich (SDM79 with 10 mM glucose) or glucose-free (SDM79GluFree) conditions. (B) Global protein abundance in the partially purified glycosome fraction of WT (x-axis) and Δtfeα1/Δtfeα1 cell knock cells (y-axis). Each protein identification is presented by a point at log10 of normalized peptide count values taken from the proteome data in S4 Figure. Proteins on the dashed grey line have identical normalized peptide counts in both samples; the grey lines represent a 2-fold abundance in one condition.

