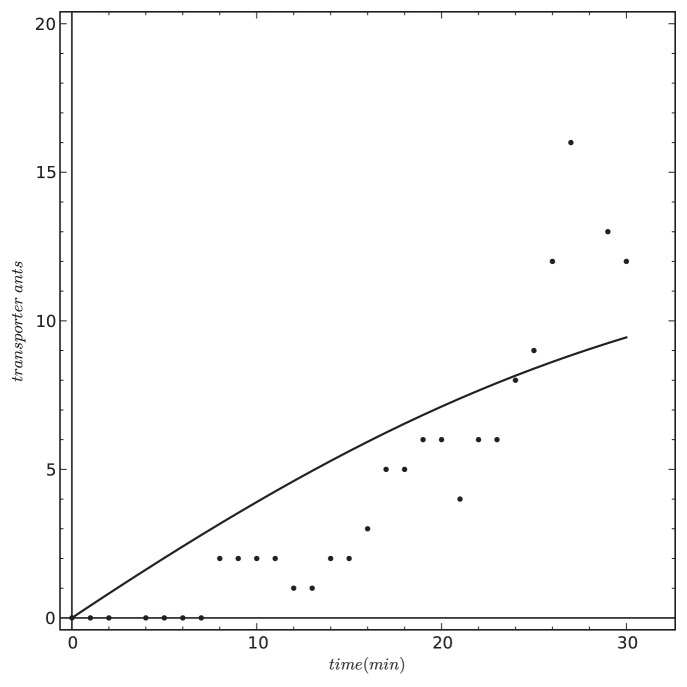
Figure 7. Predicted increase of the number of transporter ants of our model (solid line) to the data given by an empirical study (dots: data redrawn from Pratt [60].
Our model and the empirical study show an increase from 0 to approx. 10–12 ants over 30 minutes of the experimental run.

