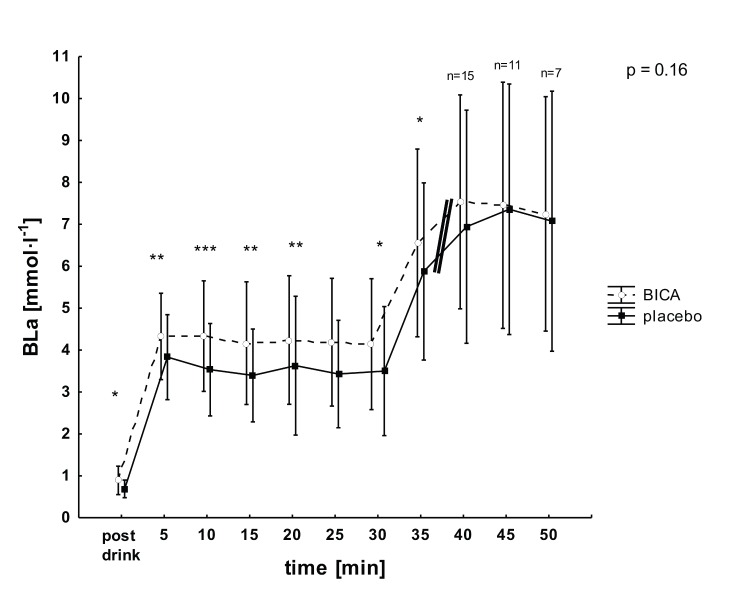
Figure 4. Blood lactate (BLa) concentrations after ingestion (post drink) and during constant load tests (mean ± SD) for the BICA (open circles) and placebo (closed squares) trials.
Double bar = decrease in number of exercising subjects (n<21). p = interaction between condition and time. * significant effect of condition, p<0.05; ** significant effect of condition, p<0.01; *** significant effect of condition, p<0.001.

