
Figure 2.
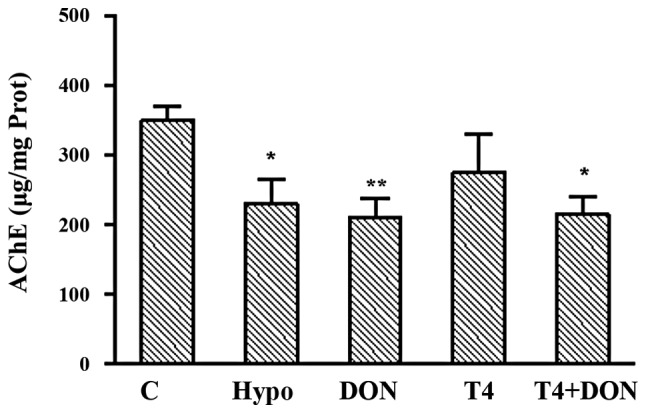
The AChE activity in the hippocampus of rats from Hypo, T4, DON, T4+DON and C groups (n=10–12), homogenates were extracted from the hippocampus of each rat. Data shown are the mean ± SEM of three independent experiments. C, control group; Hypo, hypothyroid group; DON, hypothyroid rats treated with 0.005% (w/v) DON; T4, hypothyroid rats treated with 6 μg T4/100 g body weight; T4+DON, hypothyroid rats treated with 6 μg T4/100 g body weight beside adding 0.005% (w/v) DON to the drinking water; C, Control group. *P<0.05; **P<0.01 compared with C. T4, thyroxine; DON, donepezil; AChE, acetylcholinesterase; SEM, standard error of the mean; w/v, weight/volume.