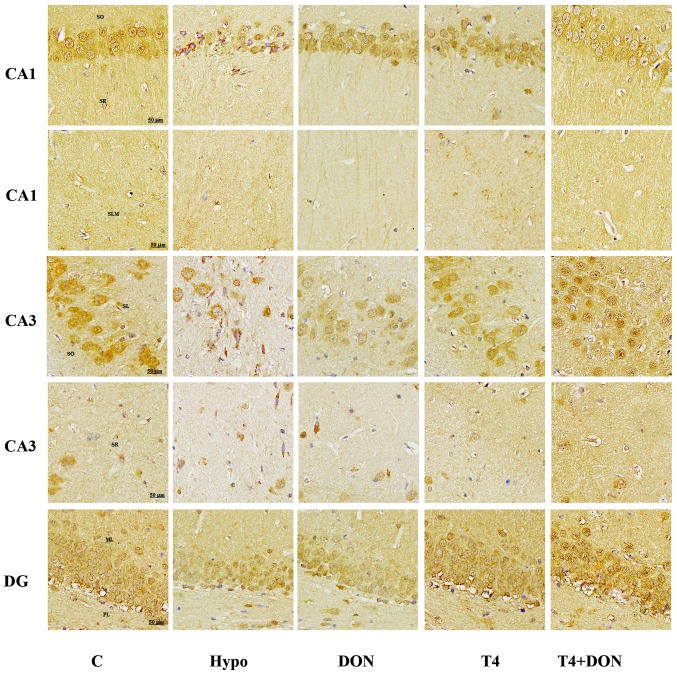
Figure 3.
Photomicrographs of coronal sections showing syt-1 immunoreactivity in CA1, CA3 and DG subregions of hippocampus of rats from Hypo, T4, DON, T4+DON and C groups (n=10–12). Distinct punctate spots of reaction product were observed in every layer of CA1, CA3 and DG subregions; note that slight decrease in overall staining intensity of CA1-SO, CA1-SR, CA3-SL, CA3-SR and DG-ML in the Hypo, DON and T4 groups was observed; the overall staining intensity was equal in CA1-SLM, CA3-SO and DG-PL of five groups; magnification: ×400, scale bar = 50 μm. Hypo, hypothyroid group; DON, hypothyroid rats treated with 0.005% (w/v) DON; T4, hypothyroid rats treated with 6 μg T4/100 g body weight; T4+DON, hypothyroid rats treated with 6 μg T4/100 g body weight beside adding 0.005% (w/v) donepezil to the drinking water; C, Control group. Syt-1, synaptotagmin-1; T4, thyroxine; DON, donepezil; DG, dentate gyrus; SO, stratum oriens; SR, stratum radiatum; SLM, stratum lacunosum-moleculare; SL, stratum lucidum; ML, molecular layer; PL, polymorphic layer; w/v, weight/volume.

