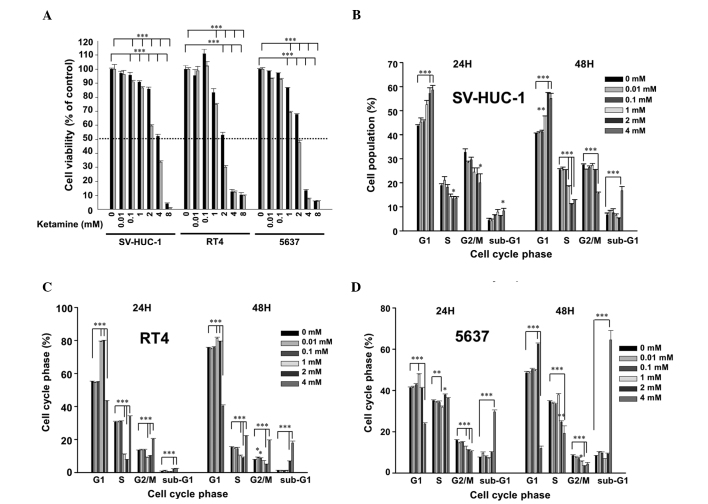
Figure 1.
Cytotoxicity of ketamine on SV-HUC1, RT4 and 5637 cells. (A) Cytotoxicity of 0–8 mM ketamine. The cells were treated with 0–8 mM ketamine for 24 h (black bar) and 48 h (gray bar), and the cell viability was analyzed by an MTT assay. (B–D) Cell cycle distribution changed following incubation with 0–4 mM ketamine for 24 and 48 h. The cells were collected for cell cycle analysis following ketamine treatment in (B) SV-HUC1, (C) RT4 and (D) 5637 cells. Quantification performed from three independent experiments. *P<0.05, **P<0.01, ***P<0.001, significant difference between the control and ketamine-treated cells.

