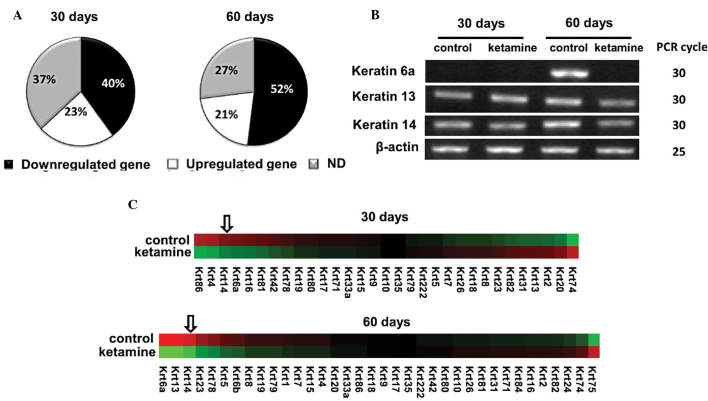
Figure 3.
Comparison of keratin family gene expression in the control and ketamine-treated mouse bladders. (A) The pie chart of keratin family genes reveals the percentage of downregulated, upregulated and ND keratin genes. (B) Polymerase chain reaction analysis of three keratin gene expression. The RNA was extracted from mouse bladders following normal saline (control) or 30 mg/kg/day ketamine (ketamine) i.p. injection for 30 and 60 days. The product sizes of keratin 6a, 13, 14 and β-actin are 486, 375, 399 and 623 bp, respectively. (C) Heat map of keratin gene expression. The map was created using the Cluster 3.0. The genes are arrayed from the most downregulated (left) to the most upregulated (right).

