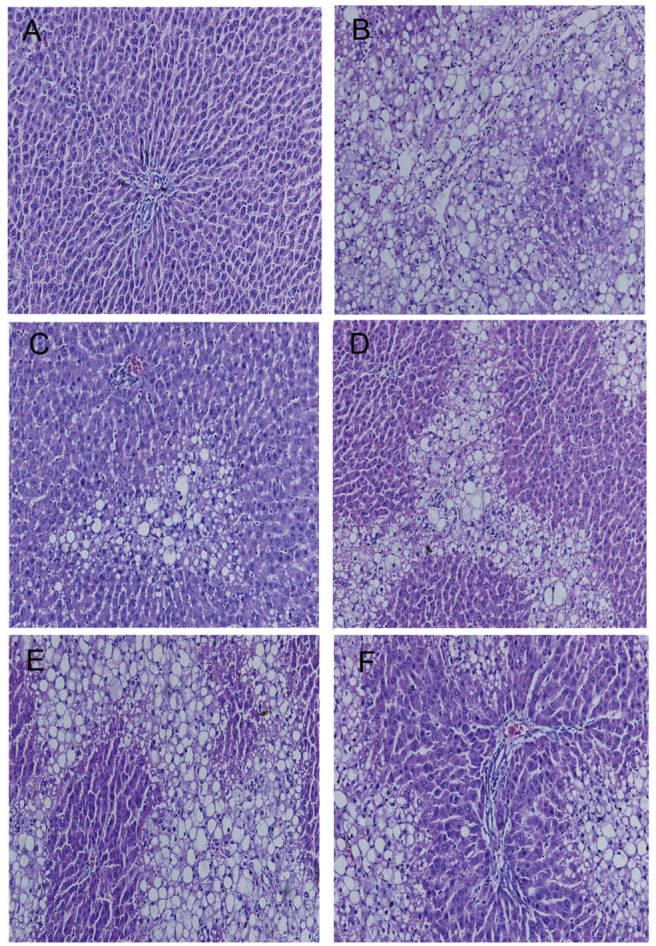
Figure 2.

Effect of APE on the tissue morphology of fibrotic rat liver as indicated by hematoxylin and eosin staining (magnification, ×100). (A) Normal group, liver sections showed normal hepatic cells with well preserved cytoplasm, prominent nucleolus and central vein. (B) Model group, liver sections showed fatty acid degeneration, necrosis, hepatocyte ballooning and inflammatory cells infiltration. (C) APE group (5.2 g/kg); (D) APE group (2.6 g/kg); and (E) APE group (1.3 g/kg). Liver sections showed a dose-depenent reduction in the degree of liver injury and inflammation. (F) Colchicine 0.1 mg/kg, liver section showed a less severe degree of liver injury. APE, Astragalus and Paeoniae radix rubra extract.
