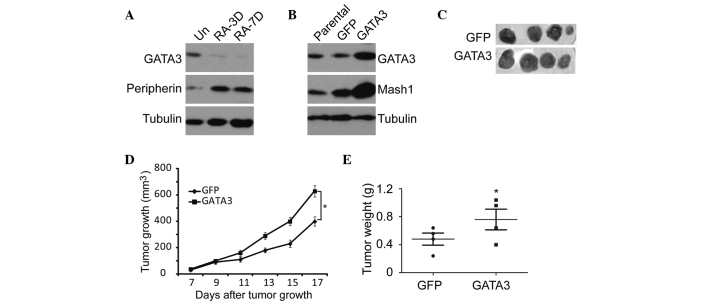
Figure 5.
Effect of GATA3 overexpression on the tumorigenicity of neuroblastoma cells. (A) Western blot analysis of GATA3 and peripherin expression in SK-N-SH cells treated with RA or DMSO. (B) Western blot analysis of GATA3 and Mash1 expression in SK-N-SH cells with GFP or GATA3 overexpression. α-tubulin levels were used as a loading control. (C) Tumor growth in NOD/SCID mice injected with indicated SK-N-SH cells. (D) Scatter plot of xenograft tumor weight with horizontal lines indicating the mean per group. (E) Xenograft tumor volume was measured using calipers. *P≤0.05. Scale bar=5 cm. GFP, green fluorescent protein; Un, untreated; RA-3D/RA-7D, three and seven days, respectively, following retinoic acid administration.

