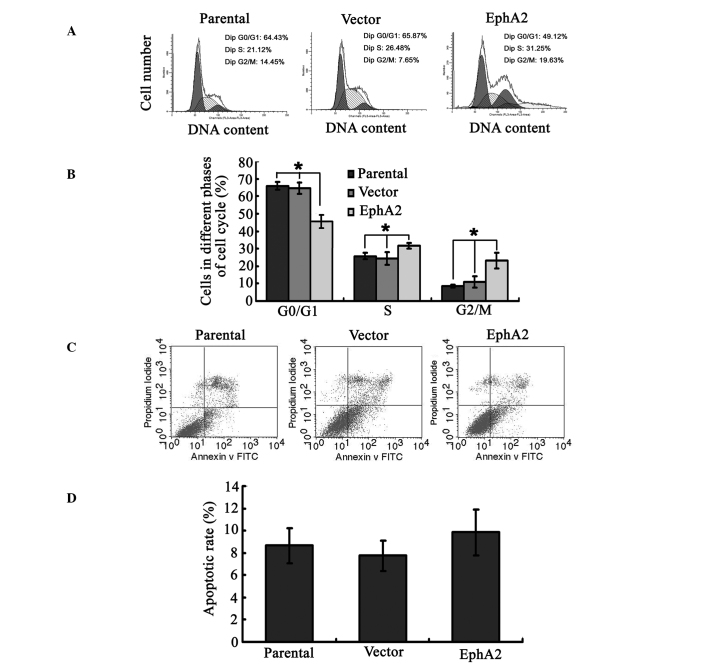
Figure 2.
Effect of EphA2 over-expression on cell-cycle distribution and apoptosis following exposure to paclitaxel. (A) Graphs of cell cycle distribution in each group. (B) Percentages of cells in different cell cycle phases in each group. (C) Graphs showing apoptosis in each group. (D) Percentage of apoptotic cells in each group. Results are presented as the mean ± standard deviation of at least three independent experiments. *P<0.05. FITC, fluorescein isothiocyanate; EphA2, ephrin type-A receptor 2.

