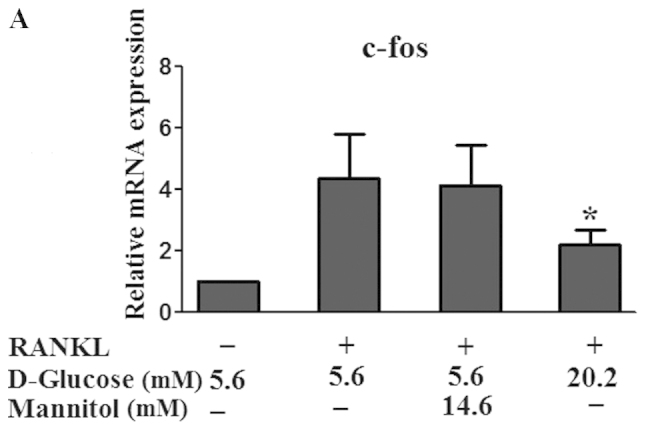
Figure 3.


Effect of high glucose on the mRNA expression levels of c-fos and NFATc1. RAW264.7 cells were seeded at a density of 1×10⁵ cells/well in 6-well plates and cultured with RANKL and different doses (5.6 and 20.2 mM) of D-glucose or mannitol for 5 days. The mRNA expression levels of (A) c-fos and (B) NFATc1 were analyzed using reverse transcription-quantitative polymerase chain reaction. Data are expressed as the mean ± standard deviation of the quantification of target expression relative to the untreated group following normalization against β-actin (2−ΔΔCt method). The untreated group were defined as the standard (=1). *P<0.05 and **P<0.01 vs 5.6 mM glucose-treated cells. RANKL, receptor activator of nuclear factor-κB ligand; NFATc1, nuclear factor of activated T cells c1.
