Fig. 1.

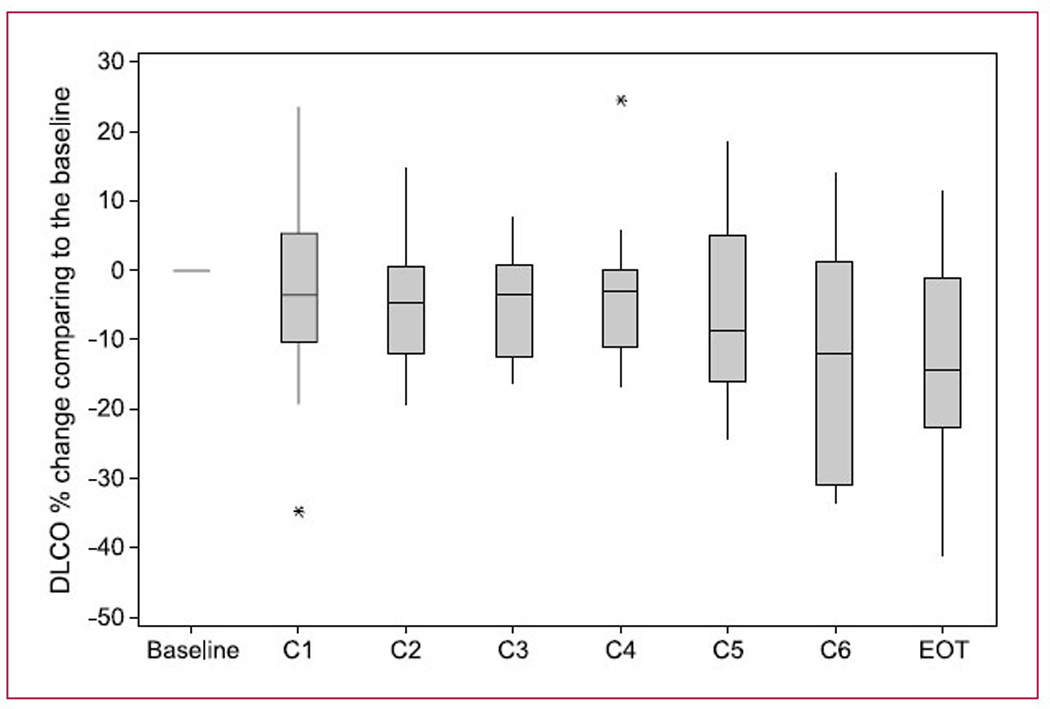
DLCO changes with cycle of treatment. This figure shows the measured DLCO changes (mean) from each patient during each cycle of treatment and at end of treatment (EOT). Asterisks, single outlier measurements.

DLCO changes with cycle of treatment. This figure shows the measured DLCO changes (mean) from each patient during each cycle of treatment and at end of treatment (EOT). Asterisks, single outlier measurements.