Fig. 2.

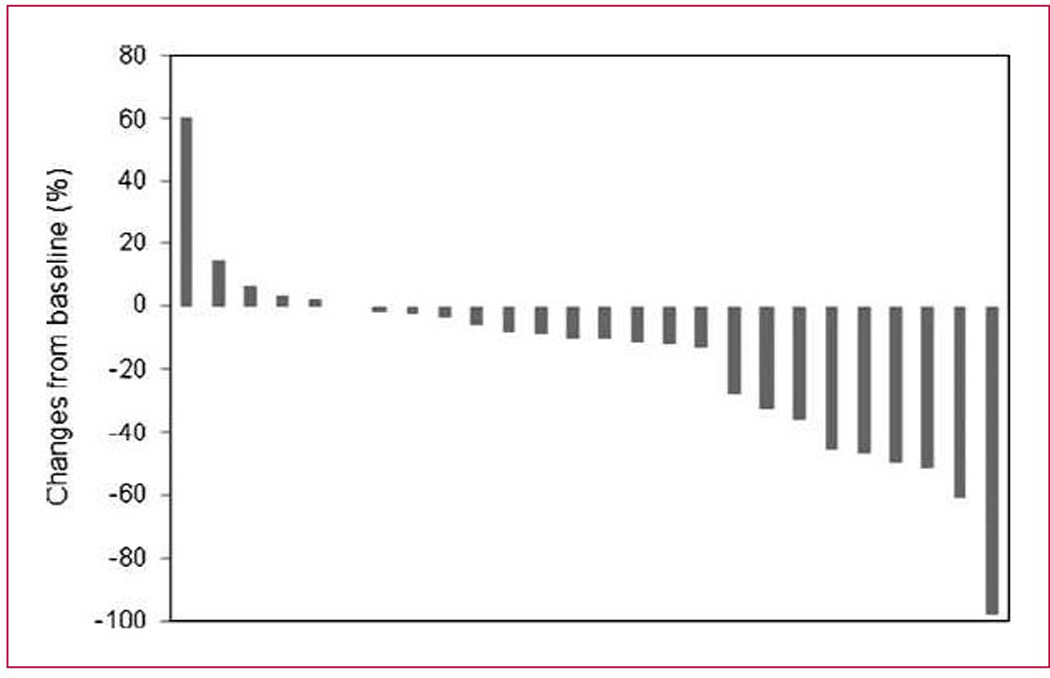
Waterfall plot of tumor size. This figure plots the percentage change from baseline (using Response Evaluation Criteria in Solid Tumors measurements) of the best response seen in treated patients.

Waterfall plot of tumor size. This figure plots the percentage change from baseline (using Response Evaluation Criteria in Solid Tumors measurements) of the best response seen in treated patients.