
Figure 1.
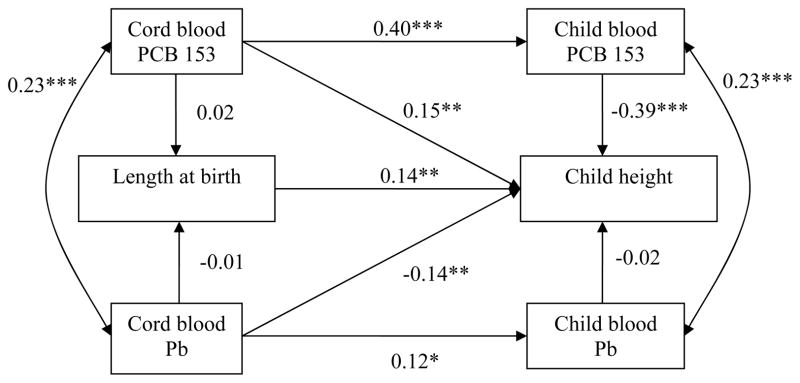
Path model, relating PCB 153 and Pb concentrations in cord and child blood to height at birth and in 8–14 year-old children.
Abbreviations: PCB 153, polychlorinated biphenyl congener 153; Pb, lead.
A single arrow represents a regression coefficient adjusted for the other variables in the model. A double-headed arrow represents a correlation coefficient.
* p ≤ 0.05, ** p ≤ 0.01, *** p ≤ 0.001.
Adjustment for birth length: maternal height, pregnancy smoking and drinking, gestational age, sex; adjustment for child height: maternal height, pregnancy smoking, sex, breastfeeding duration, child age at follow-up, food insecurity.
Fit statistics: χ2 = 31.20 (25), p = 0.18; CFI = 0.99; RMSEA = 0.03, CI: 0.00 – 0.06.