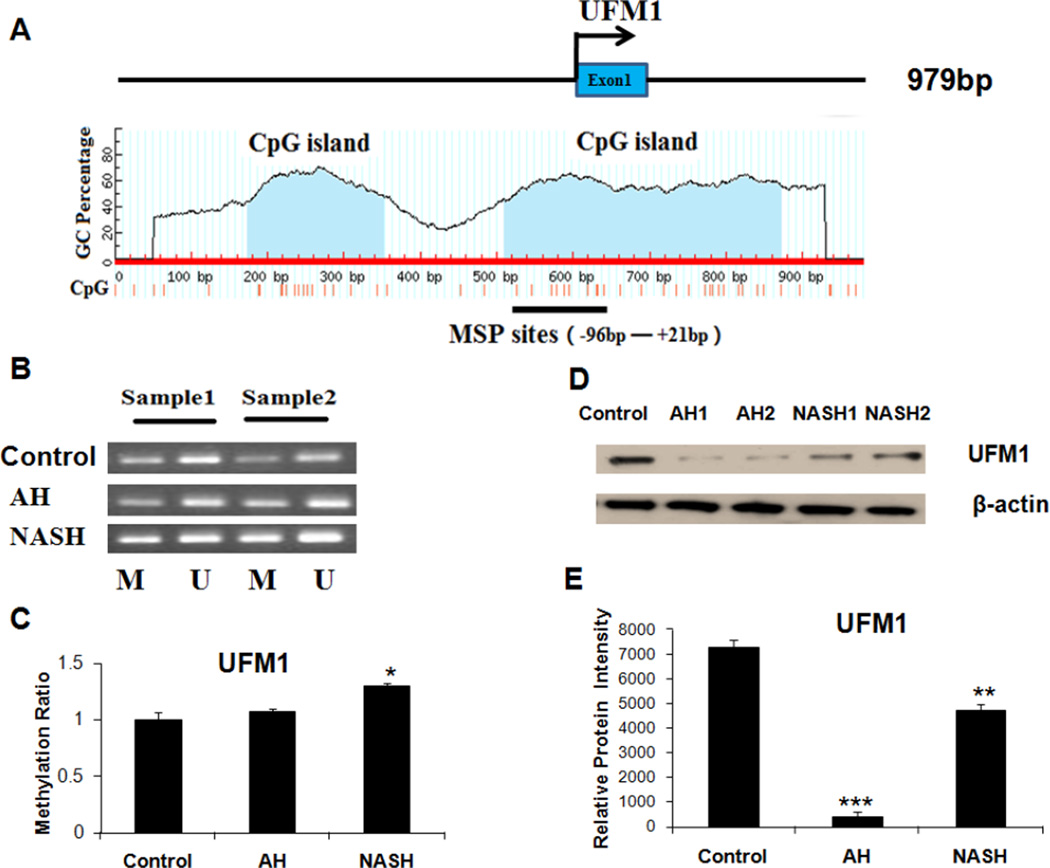
Figure 2.
A, The Ufm1 CGI. Transcription start site is indicated by an arrow. The CGI and MSP regions analyzed are indicated. B, Representative analyses of Ufm1 promoter methylation in two AH and NASH patients. M, methylated; U, unmethylated. C, The methylation ratio of Ufm1 in AH and NASH was normalized to that in normal liver tissues. D, Western blot analysis of Ufm1 protein in AH and NASH biopsies with MDBs present. E, Protein expression intensity of Ufm1 in AH and NASH. * p<0.05, * * p<0.01 and ***p<0.001 by t-test with SigmaStat software.

