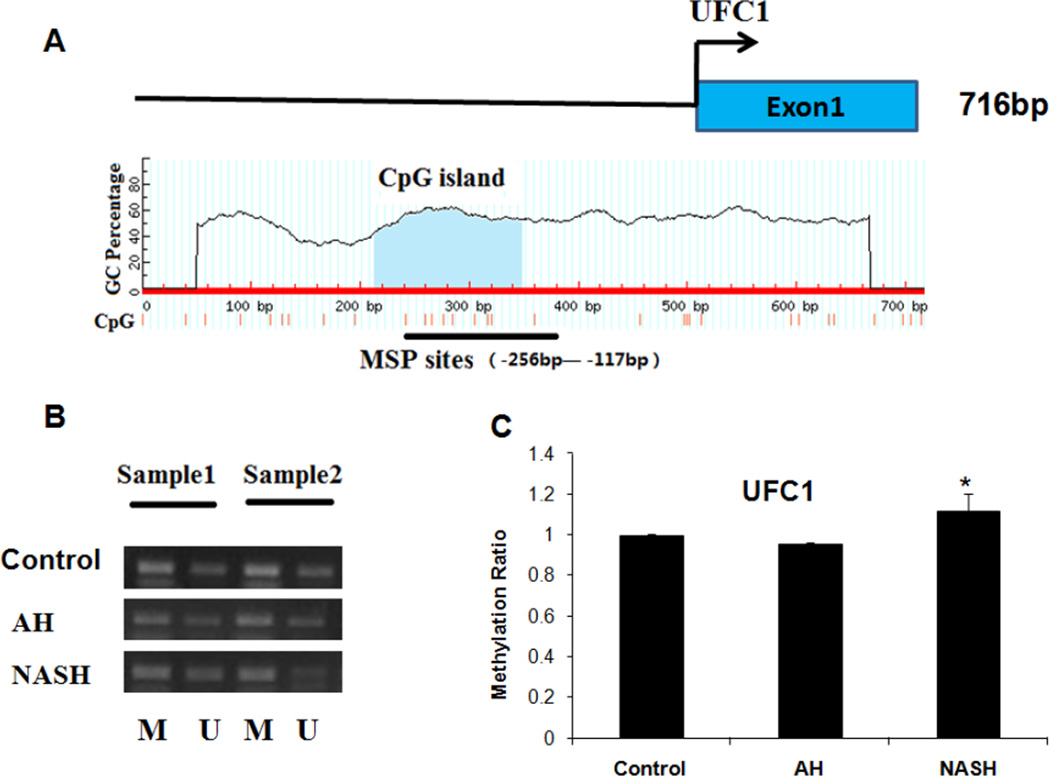
Figure 3.
Analyses of Ufc1 methylation in normal liver tissues, AH and NASH by MSP. A, the Ufc1 CGI. Transcription start site is indicated by an arrow. The CGI and MSP regions analyzed are indicated. B, Representative analyses of Ufc1 promoter CpG methylation in AH and NASH patients. M, methylated; U, unmethylated. C, The methylation ratio of Ufc1 in AH and NASH was normalized to that in normal liver tissues. * p<0.05 by t-test with SigmaStat software.

