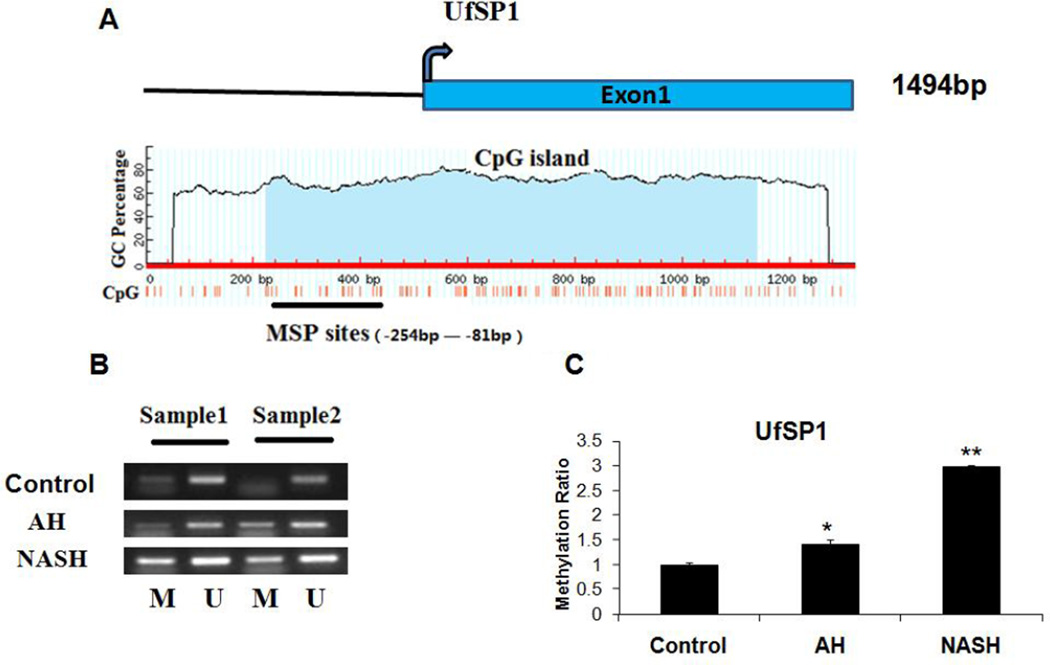
Figure 4.
Analyses of UfSP1 methylation in normal tissues, AH and NASH by MSP. A, the UfSP1 CGI. Transcription start site is indicated by a curved arrow. The CGI and MSP regions analyzed are indicated. B, Representative analyses of UfSP1 promoter methylation in AH and NASH patients. M, methylated; U, unmethylated. C, The methylation ratio of UfSP1 in AH and NASH was normalized to that in normal liver tissues. * p<0.05 and **p<0.01 by t-test with SigmaStat software.

