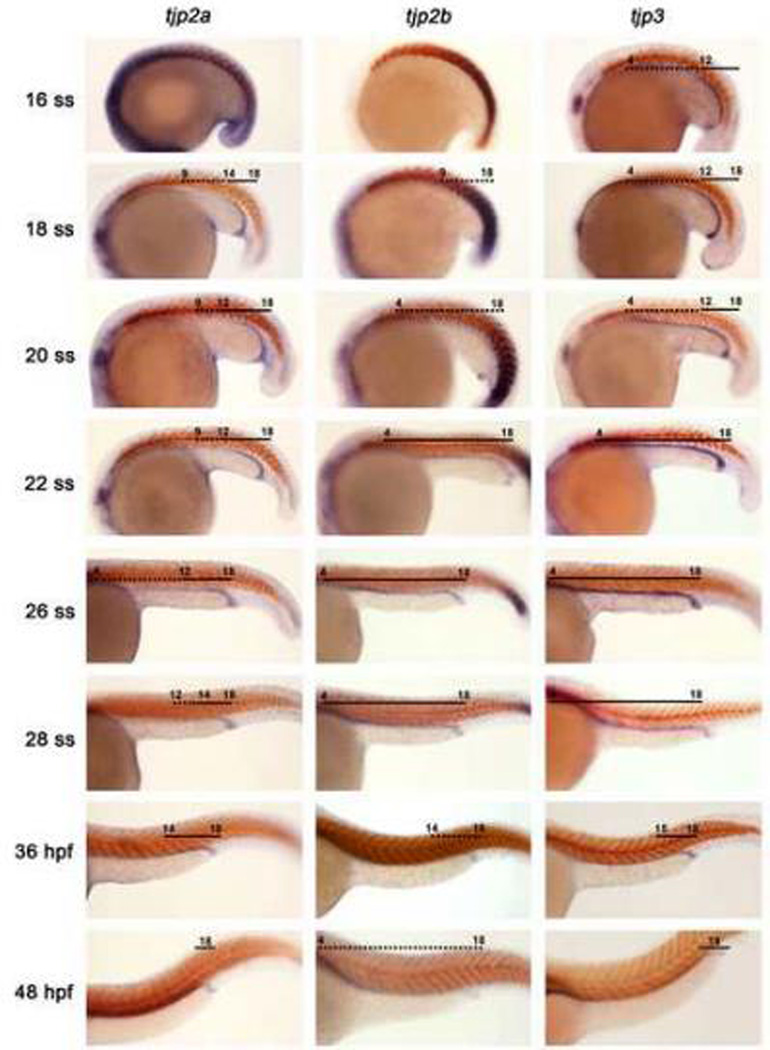
Figure 1. Expression of tjp transcripts during nephrogenesis.
Whole mount in situ hybridization analysis for tjp2a, tjp2b, and tjp3 (purple) and smyhc1 (red) at the 16–28 somite stage (ss), 36 and 48 hours post fertilization (hpf) in wild-type embryos. Embryos are shown in lateral views with anterior to the left. Black lines (strong expression) and dotted lines (faint expression) indicated transcript domains and comparative levels, and numbers correspond to the somite position of nephron cells.

