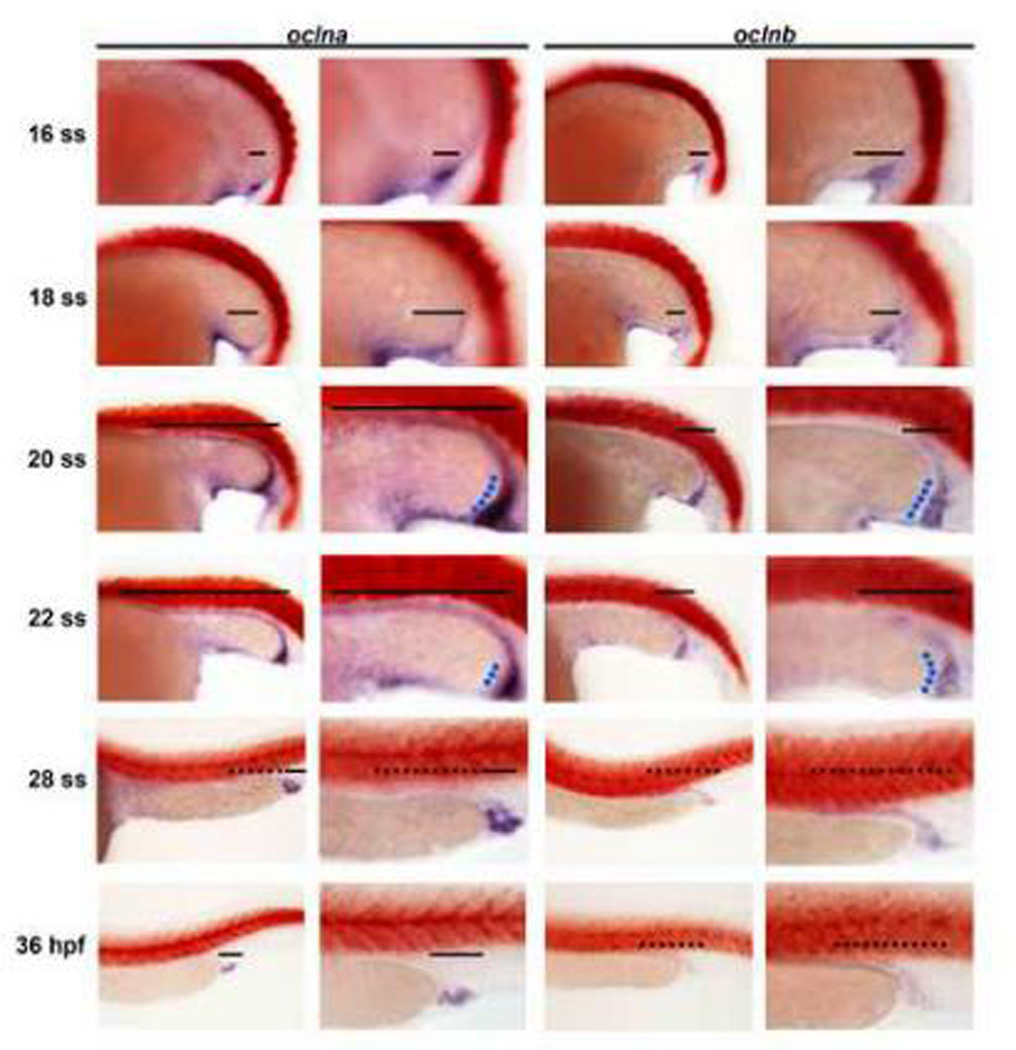
Figure 2. Expression of ocln transcripts during nephrogenesis.
Whole mount in situ hybridization analysis for oclna and oclnb (purple) and smyhc1 (red) at the 16–28 somite stage (ss), 36 and 48 hours post fertilization (hpf) in wild-type embryos. Embryos are shown in lateral views with anterior to the left. Black lines (indicating strong expression) and black dotted lines (indicating weak/low-level expression) demarcate transcript domains within the pronephros (PCT, PST, DE, DL, and PD), while blue dotted lines indicate the intense pronephros PD expression noted at particular time points.

