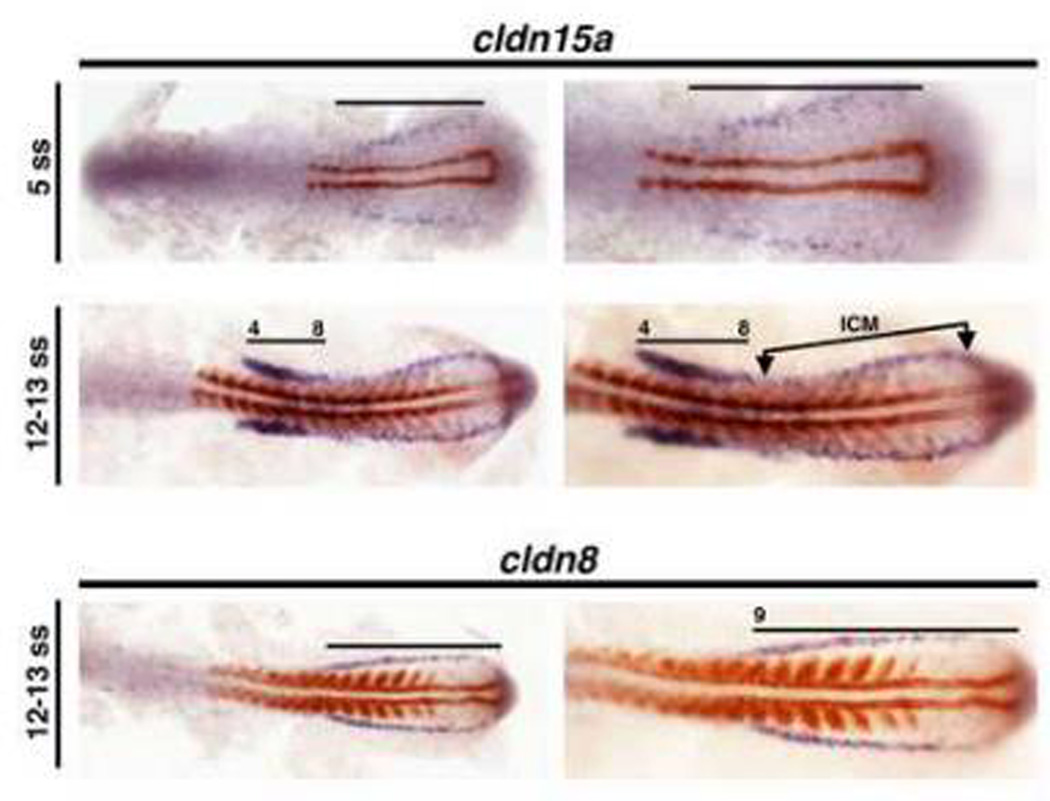
Figure 5. Renal progenitor expression domains of cldn15a and cldn8.
Whole mount in situ hybridization analysis for clnd15a (purple) and myod1 (red) at the 5–13 somite stage (ss) in wild-type embryos. Embryos are shown in dorsal view, flat-mounted, with anterior to the left. Black lines indicated transcript domains, and numbers correspond to the somite position of nephron cells. Abbreviations: inner cell mass (ICM) denotes primitive blood.

