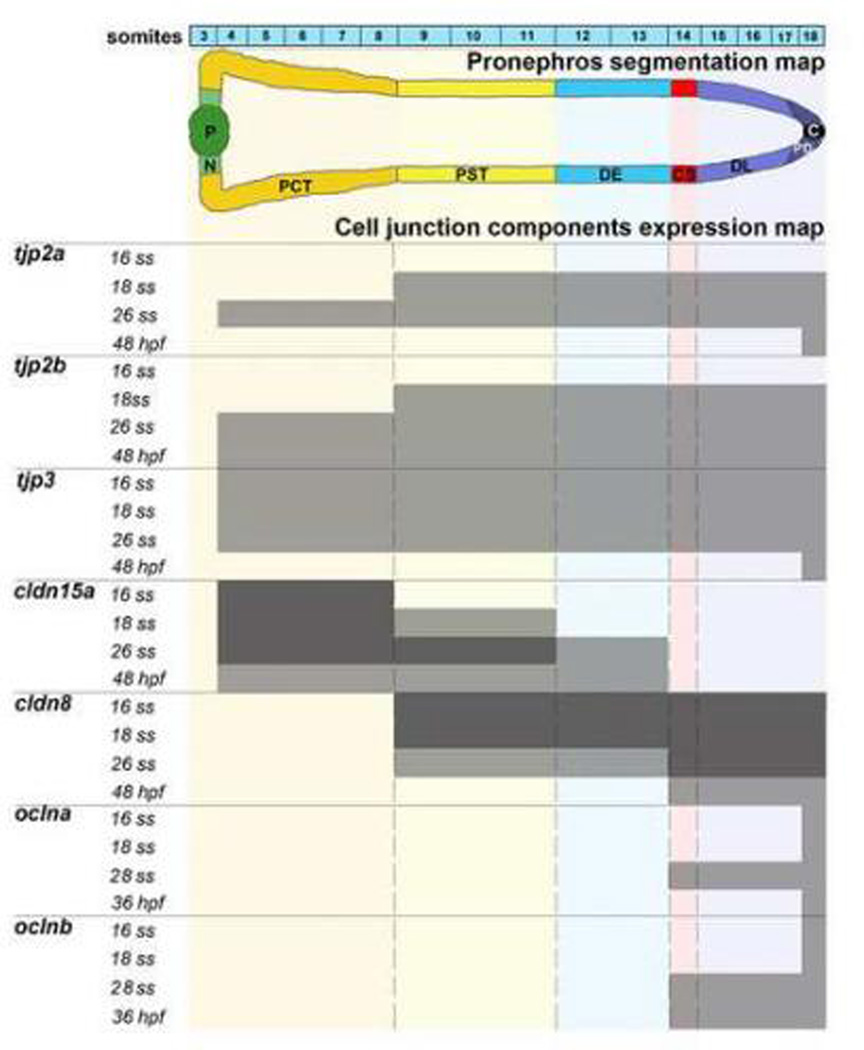
Figure 6. Spatiotemporal map of tight junction expression domains in the developing zebrafish pronephros.
(Top) Nephron segment map of the pronephros. Segment identities form adjacent to particular somites (demarcated by numbered columns). Gene expression domains (black bars demarcate high expression and gray bars demarcate low/weak expression) are schematized in the pronephros territory between the 16 somite stage (ss) and 48 hours post fertilization (hpf). (Background) Each segment region is uniquely color-coded to compare gene expression domains at each time point with the nephron segment that forms at that location. Segment color codes are as follows: PCT-orange, PST-yellow, DE-light blue, CS-red, DL-PD-dark blue.

