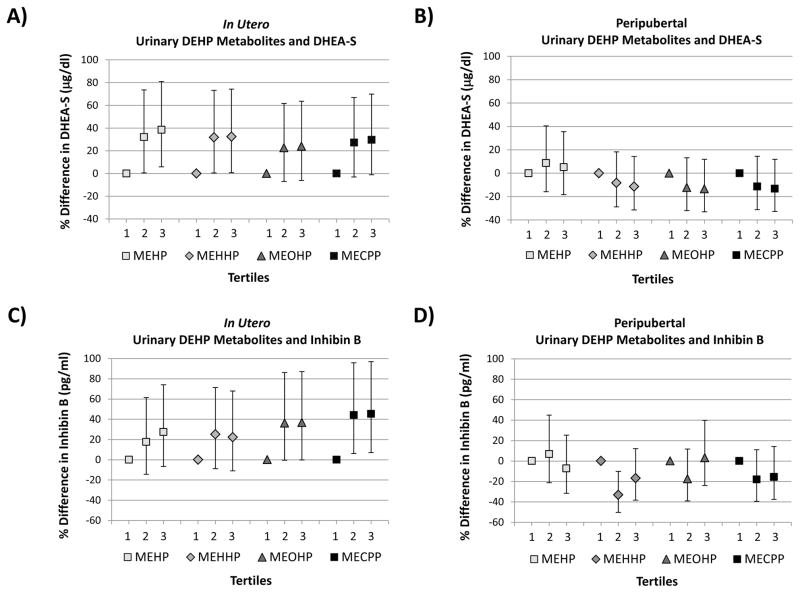
Figure 1.
Percent differences in serum hormone concentrations within the 2nd and 3rd tertiles of SG-corrected urinary DEHP metabolites compared to the 1st tertile adjusted for age and age-specific BMI z-score: A) in utero DEHP metabolites and peripubertal DHEA-S; B) peripubertal DEHP metabolites and DHEA-S C) in utero DEHP metabolites and peripubertal inhibin B; D) peripubertal DEHP metabolites and inhibin B.
p for trend:
Panel A: MEHP = 0.018; MEHHP = 0.044; MEOHP = 0.13; MECPP = 0.059
Panel B: MEHP = 0.69; MEHHP = 0.35; MEOHP = 0.27; MECPP = 0.27
Panel C: MEHP = 0.12; MEHHP = 0.21; MEOHP = 0.051; MECPP = 0.016
Panel D: MEHP = 0.62; MEHHP = 0.22; MEOHP = 0.84; MECPP = 0.27

